

A company’s success on TikTok hinges on creating videos that resonate. Don’t take on this challenge alone: Learn how to use TikTok analytics and let data guide your content. Also, find expert tips on how to use analytics to increase your brand awareness.
What Is TikTok Analytics?
TikTok analytics is a feature that provides data to help you understand how your content performs. You can check video views, the number of followers, and more. TikTok organizes analytics into three major categories: overview, content, and followers.
With over 1.2 billion monthly active users, TikTok is on pace to become one of the fastest-growing apps ever created. Initially, many considered the app to be a fad—a platform for young audiences to post silly, humorous videos. Now, TikTok has established itself among the denizens of social media glory like Facebook, Instagram, and Twitter. Businesses and brands have noticed, realizing that TikTok may offer a new, fun way to use video marketing to increase brand engagement and awareness.
Businesses hoping to market on TikTok should recognize that it features key differences from other social media platforms. For example, TikTok focuses on providing levity with humorous, creative videos that lean heavily on music. Brands should create videos that capture these elements and pay attention to trending content to get an idea of what is resonating with TikTok’s audience.
In short, marketing on TikTok involves mandatory elements of experimentation and risk. TikTok’s uniqueness comes with a caveat: Sometimes, it won’t be clear whether a video will go viral or be a flop. Luckily, you won’t be going in blind: TikTok offers in-app analytics that provides important data on key macro-level information like video views and the number of likes, comments, and shares your content is producing. TikTok analytics also shows precise per-video analytics like average watch time, total shares, and video views by region. This feature is similar to Instagram’s more well-known analytics tool, Instagram Insights.
With a palette of in-house, free metrics, anyone willing to experiment will be able to track the performance and success of their content. Armed with knowledge, you can tweak your next videos to mirror aspects of successful content and toss out ideas that didn’t resonate with viewers. In essence, TikTok’s analytics sets you up for success—so long as you monitor them.
Key Takeaways:
- You need a TikTok business account to access analytics.
- TikTok requires up to seven days to populate your analytics from the day you become a business member.
- To get information on follower gender, territory distribution, and activity, you need at least 100 followers.
- TikTok only provides content analytics for seven-day periods; for long-term tracking, regularly export your TikTok data to a spreadsheet using an in-app feature.
- On average, businesses achieve a 4.5% engagement rate on TikTok.
- Unfortunately, there’s no simple way to calculate an account’s overall reach except for summing it up manually on videos across a given time.
Who Can View TikTok Analytics?
Anyone with a business account who has published at least one public video can access TikTok analytics. For most analytics, TikTok will begin to show data seven days after you switch to a business account.
A business account provides many additional features like analytics and the ability to include a link in your bio. Luckily, the price is right—a business account is free. If you have a personal account, you can switch to a business one with a few simple clicks. Keep in mind, however, that personal accounts have access to more sounds, and only those users can have private accounts.
Once you switch to a business account TikTok will start collecting data on your videos, but you’ll have to wait seven days (from the day you set up a business account) for the data to be populated. Also, you must have posted at least one public video to access analytics.
How to Check Analytics on TikTok
To check TikTok analytics, you must post a public video on TikTok and sign up for a free business account. Then, you can use the mobile app or desktop website to access metrics.
Follow these steps to access TikTok analytics on the mobile and desktop apps:
(Note: TikTok recommends using the desktop version for a better analytics experience).
How to Check TikTok Analytics on Mobile:
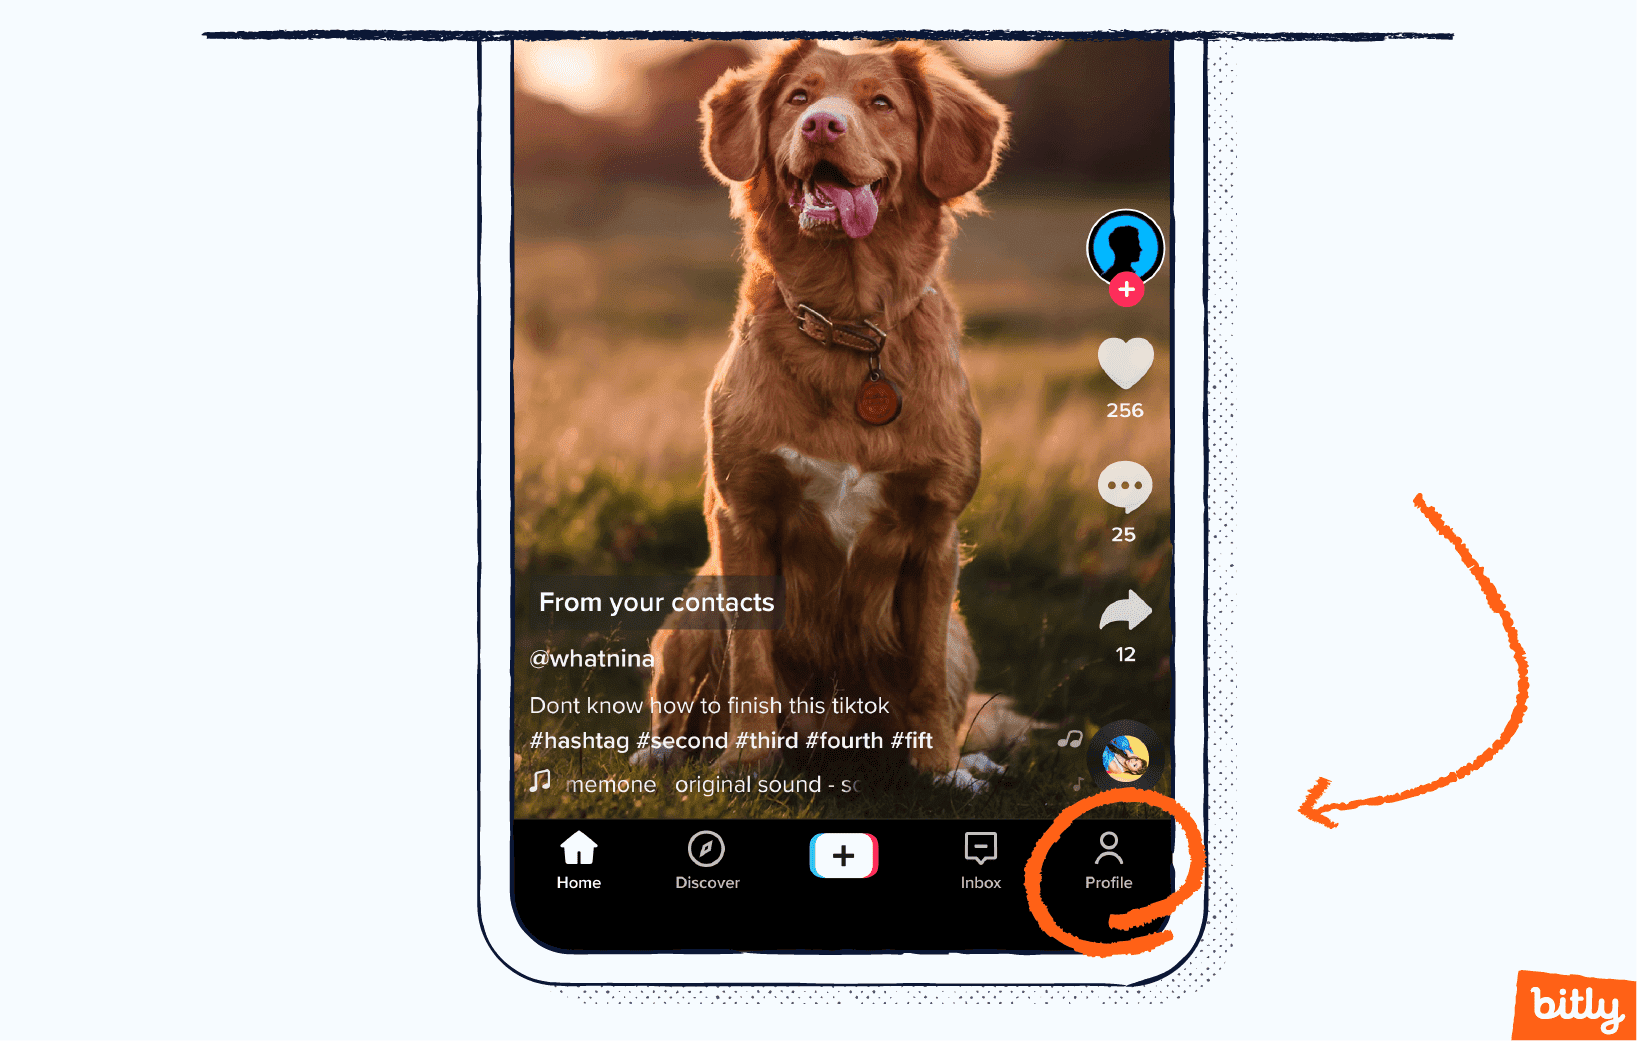
- Open the TikTok app on your mobile device and tap the Profile icon in the lower right corner.
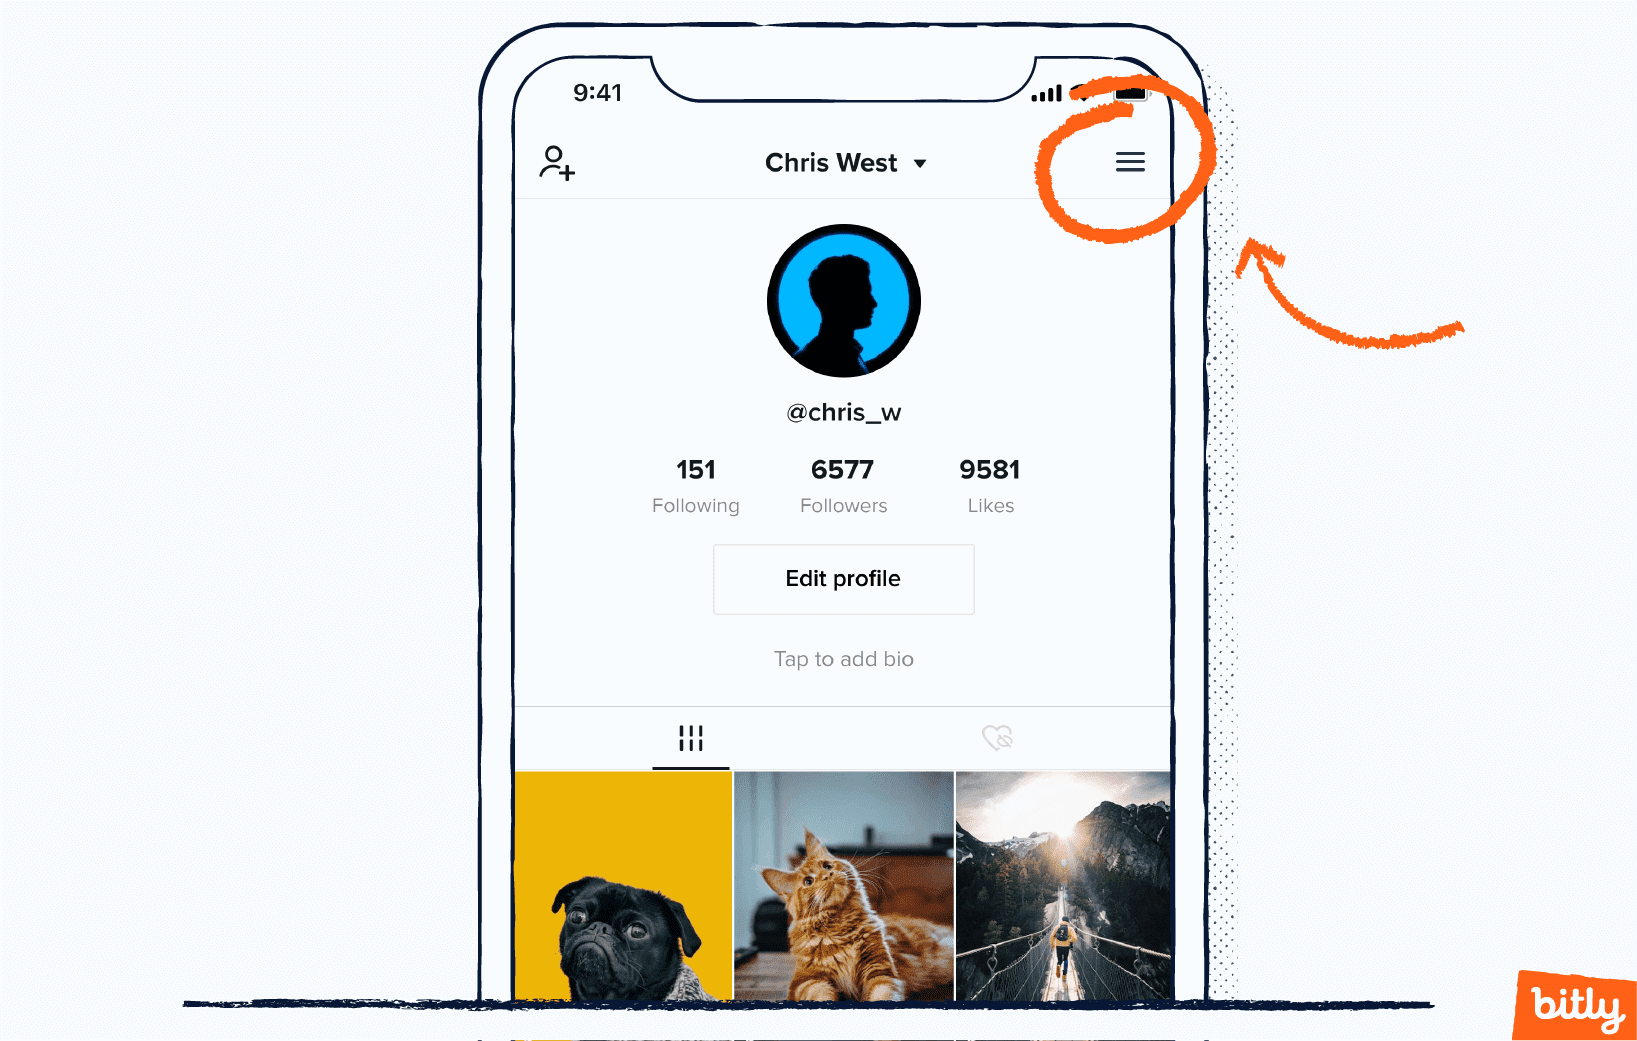
- Tap the hamburger button in the top left to access settings.
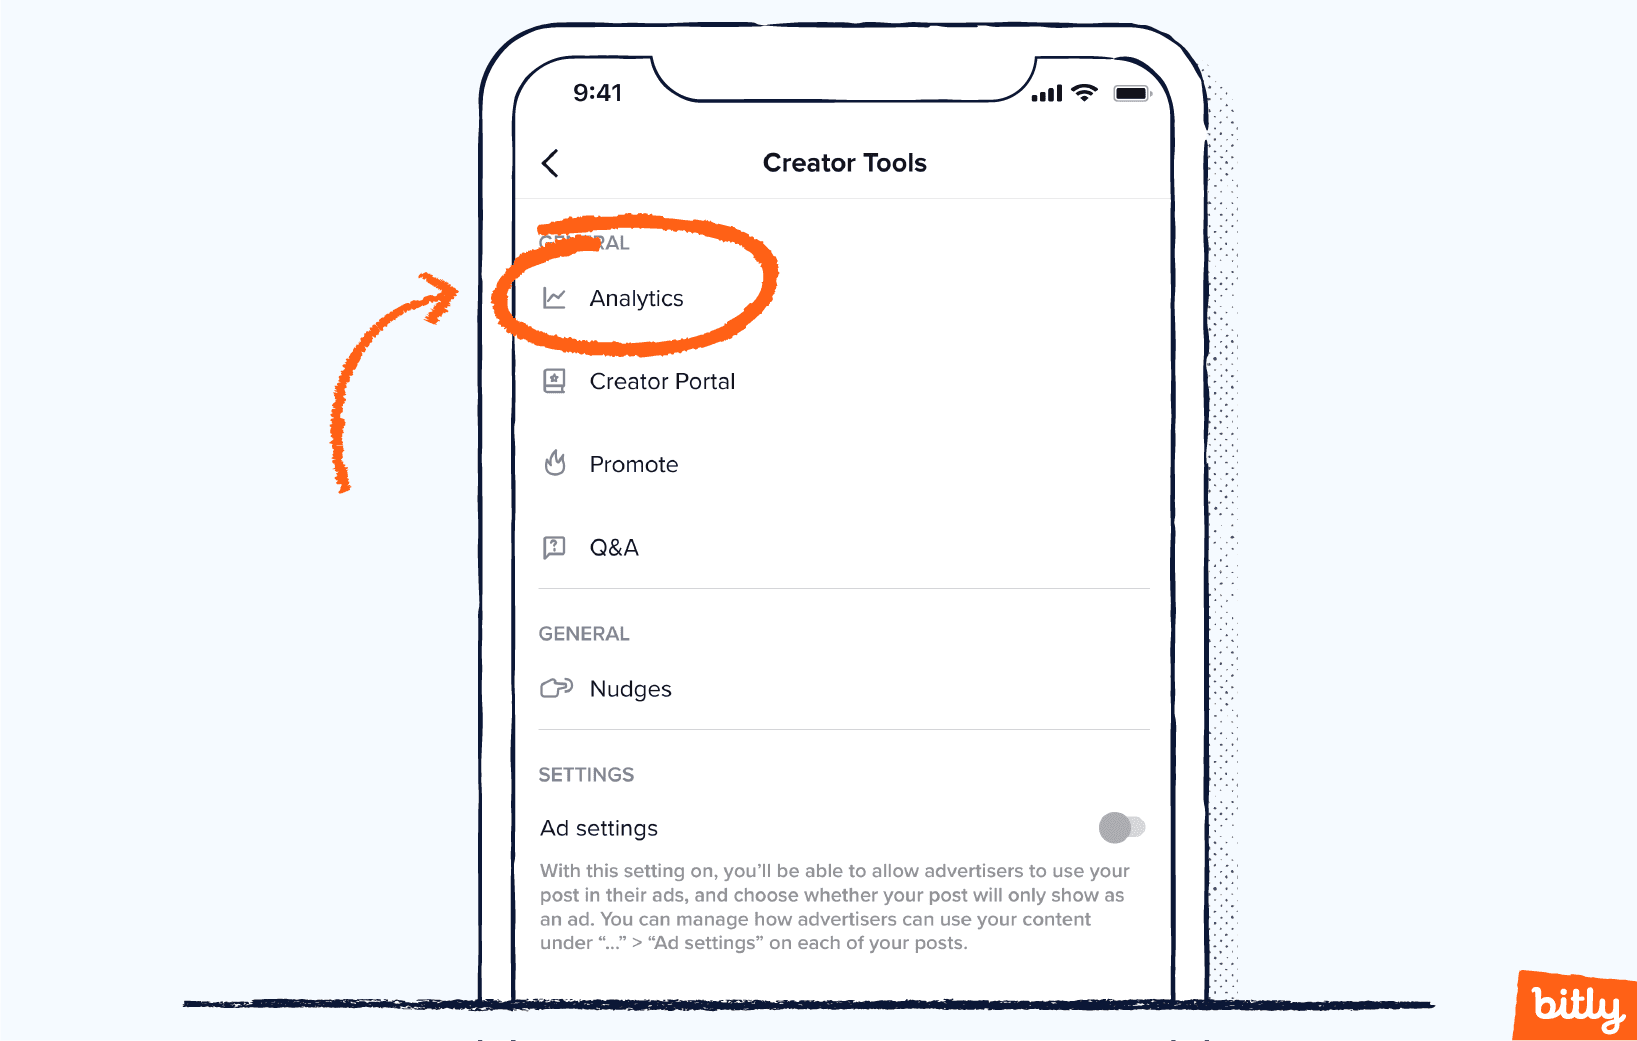
- Tap Creator tools or Business suite. Both options provide access to analytics.
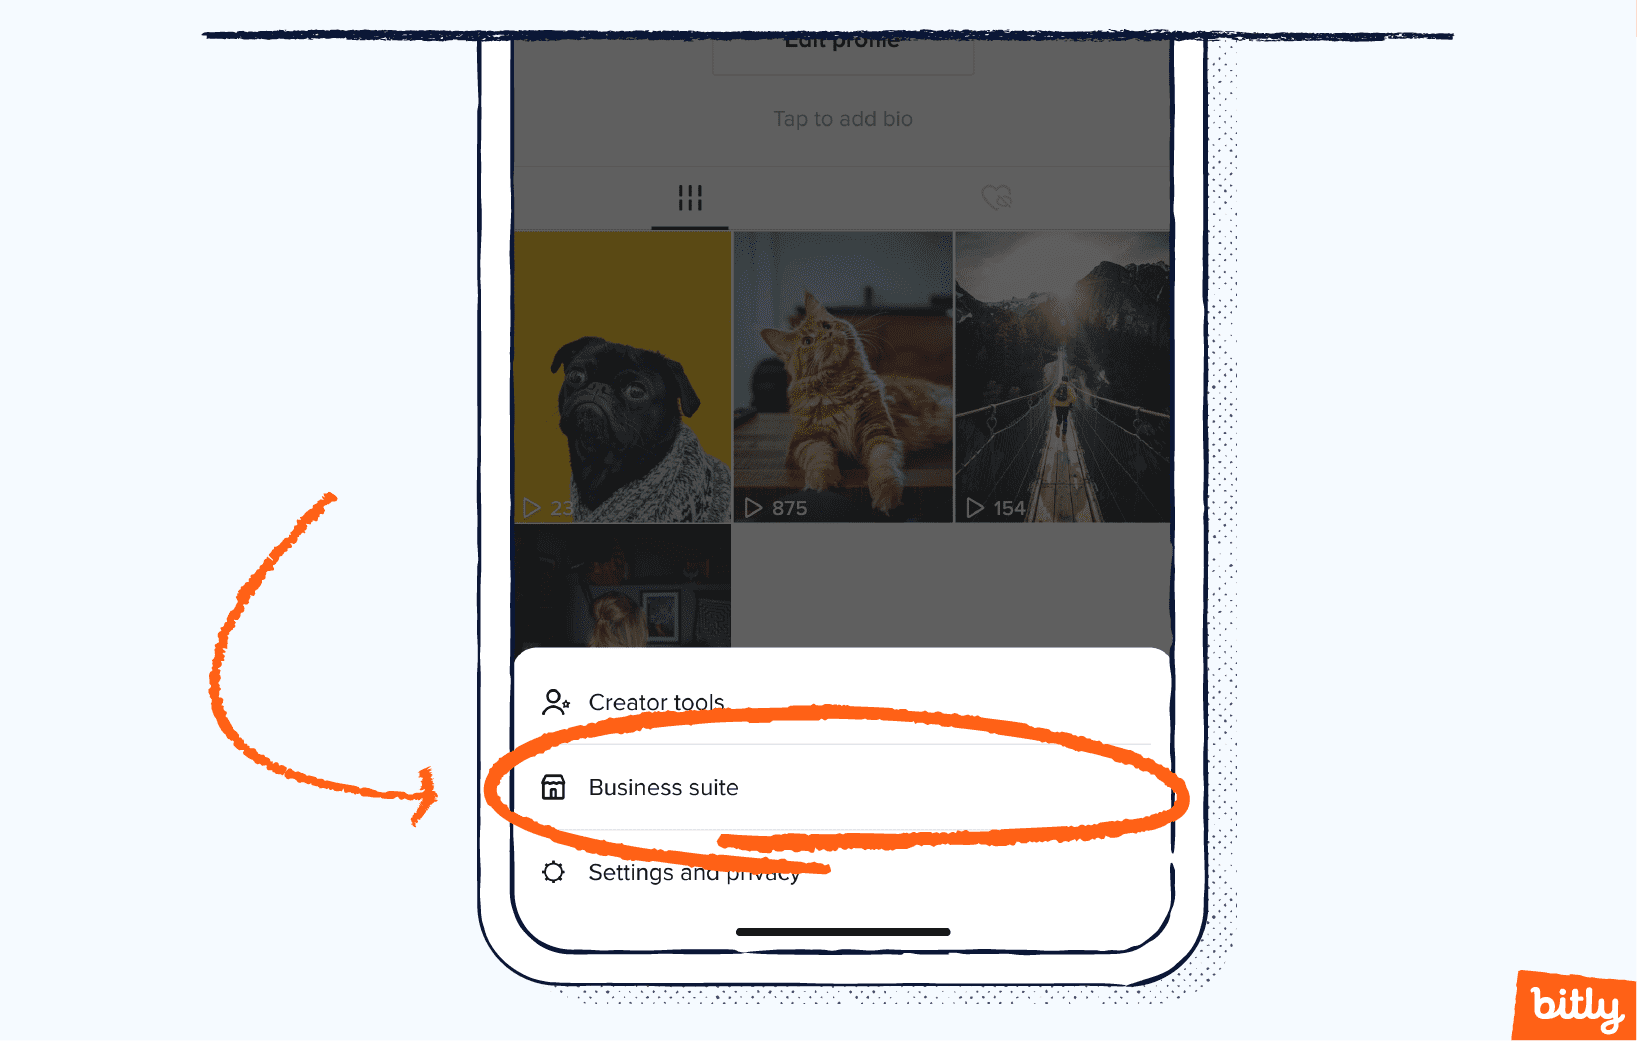
- Tap Analytics on the Business suite screen.
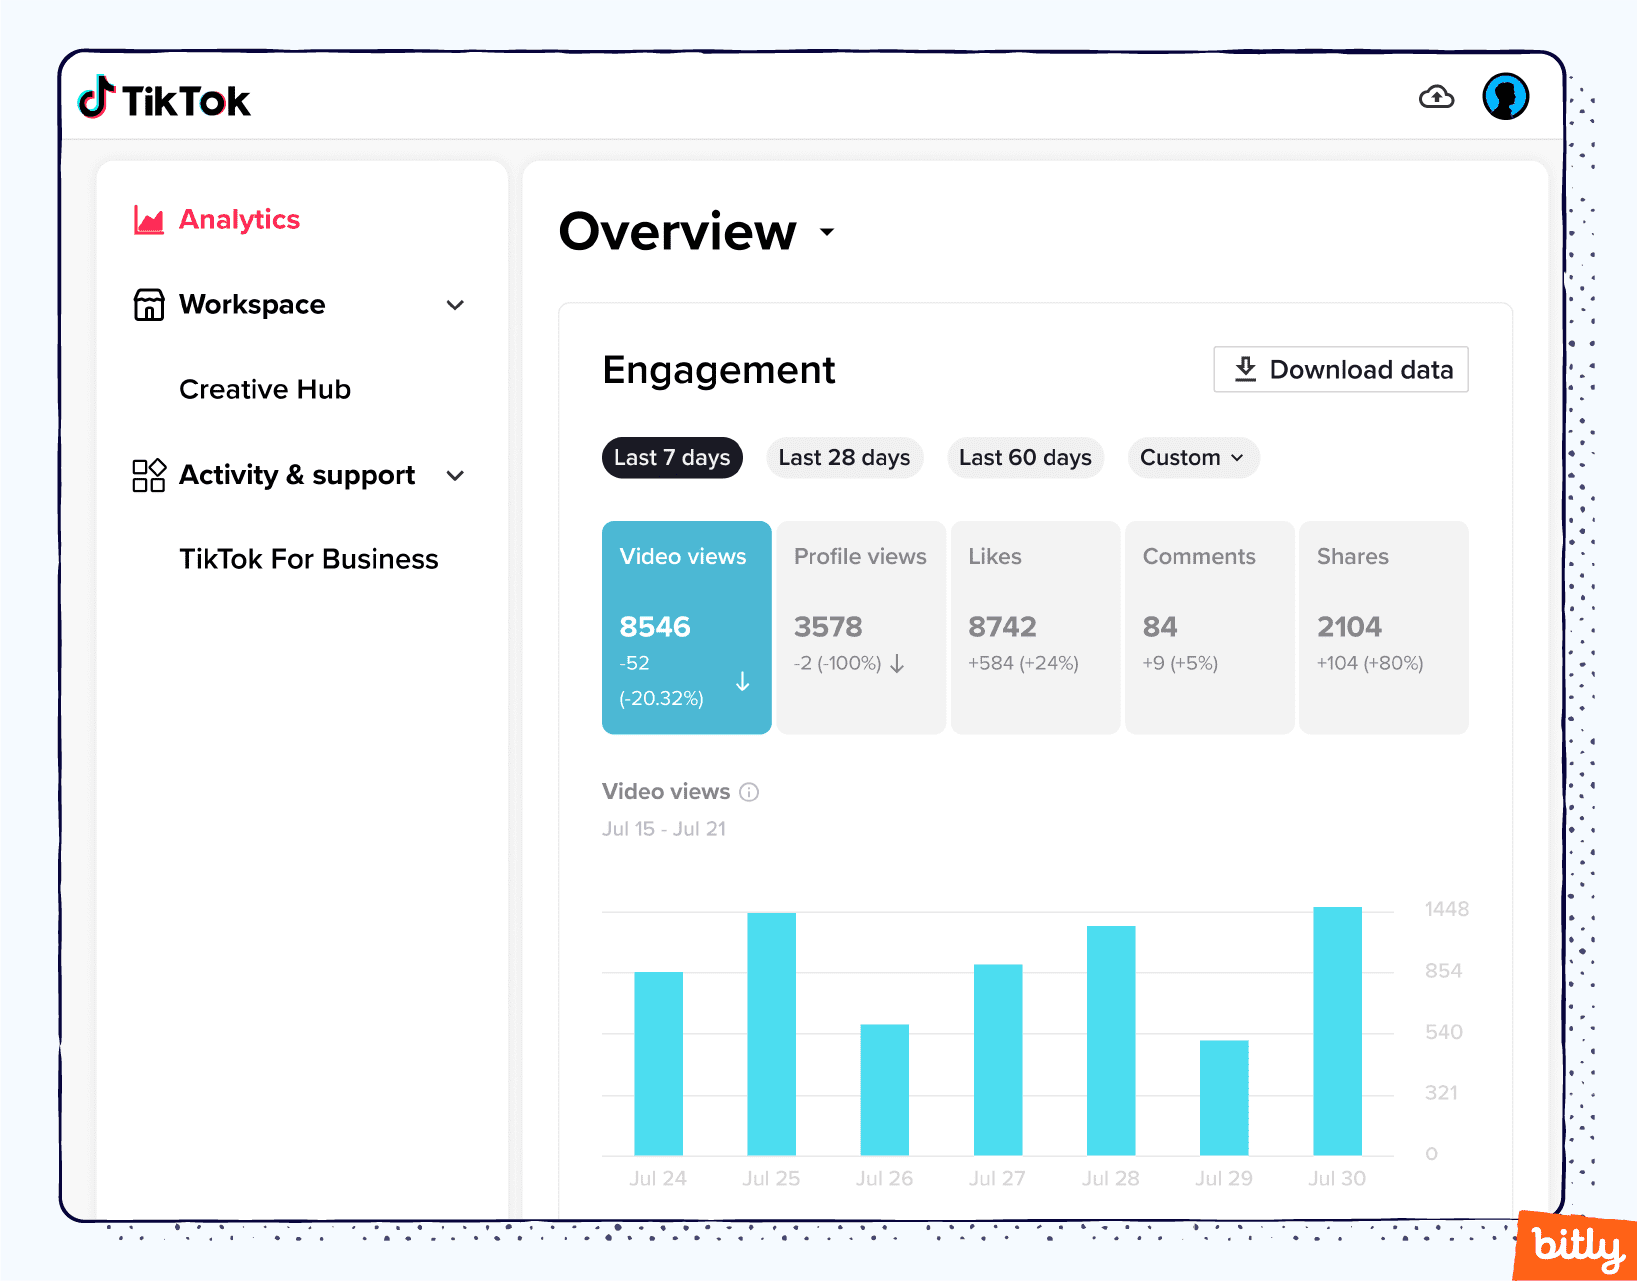
- You will see the Overview section of analytics. By default, TikTok shows you the analytics for the last seven days.
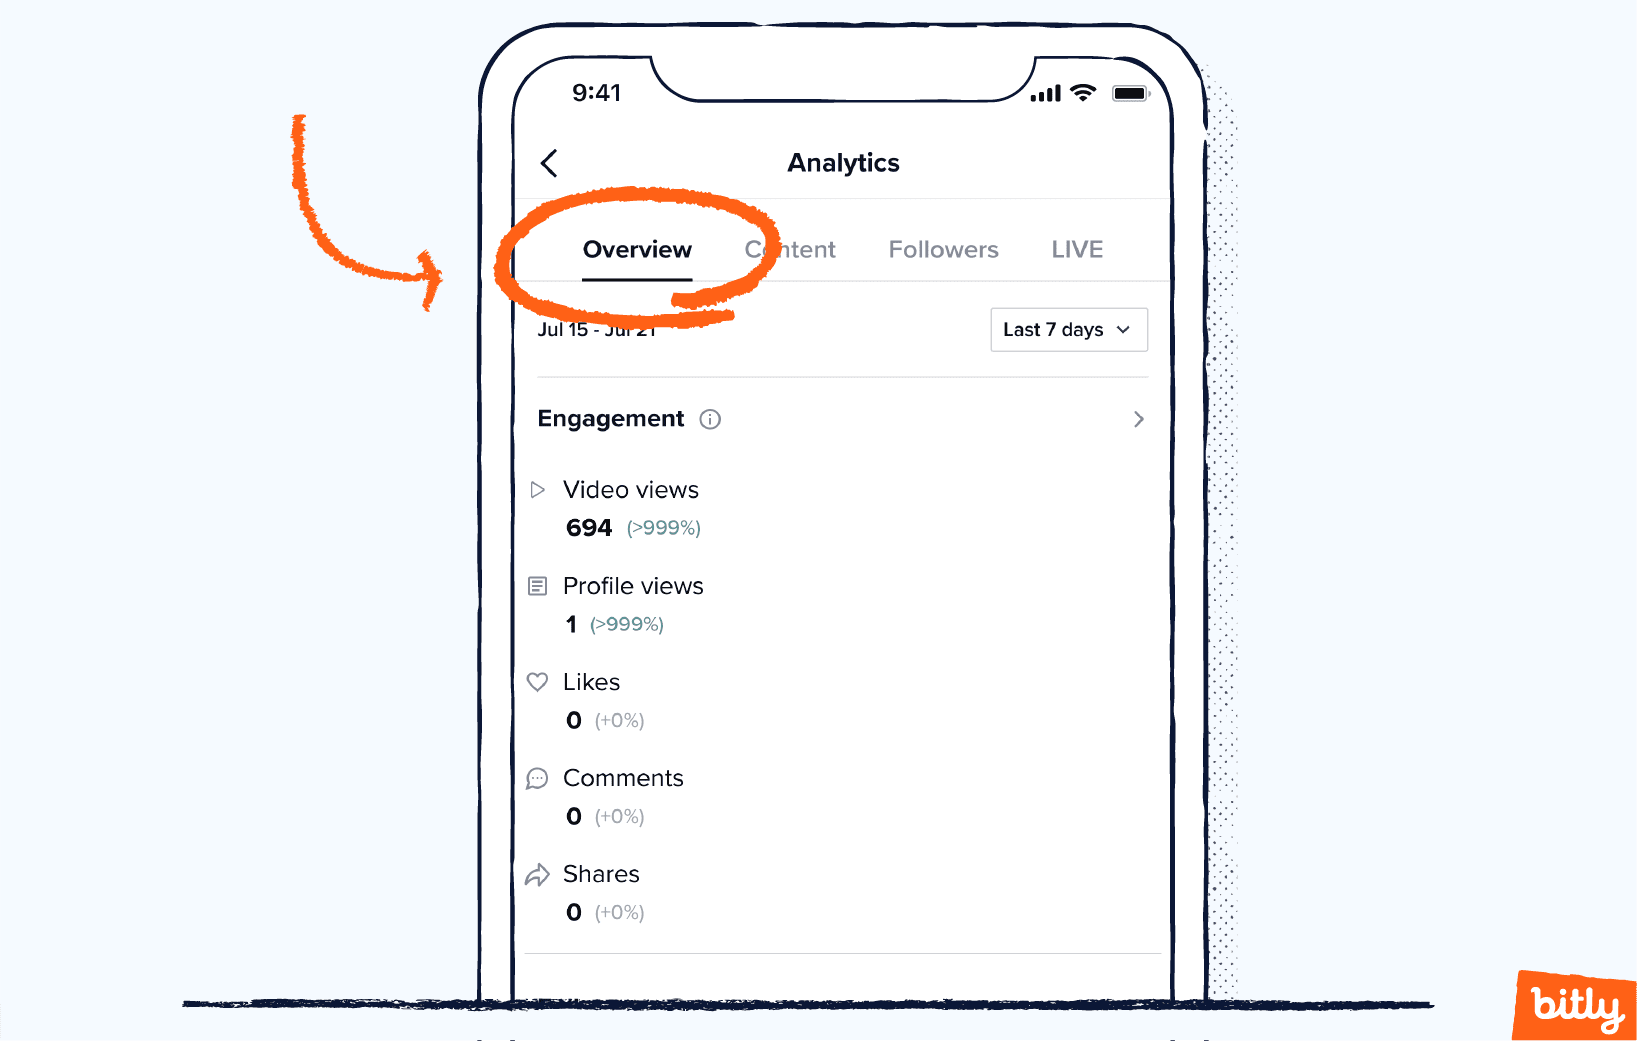
- Tap any of the four categories on the top header to switch to Content, Followers, or LIVE analytics. The section you are viewing will be underlined.
Learn more about each category, how to access key data, and how to change analytics to a custom time frame below.
How to Check TikTok Analytics on Desktop:
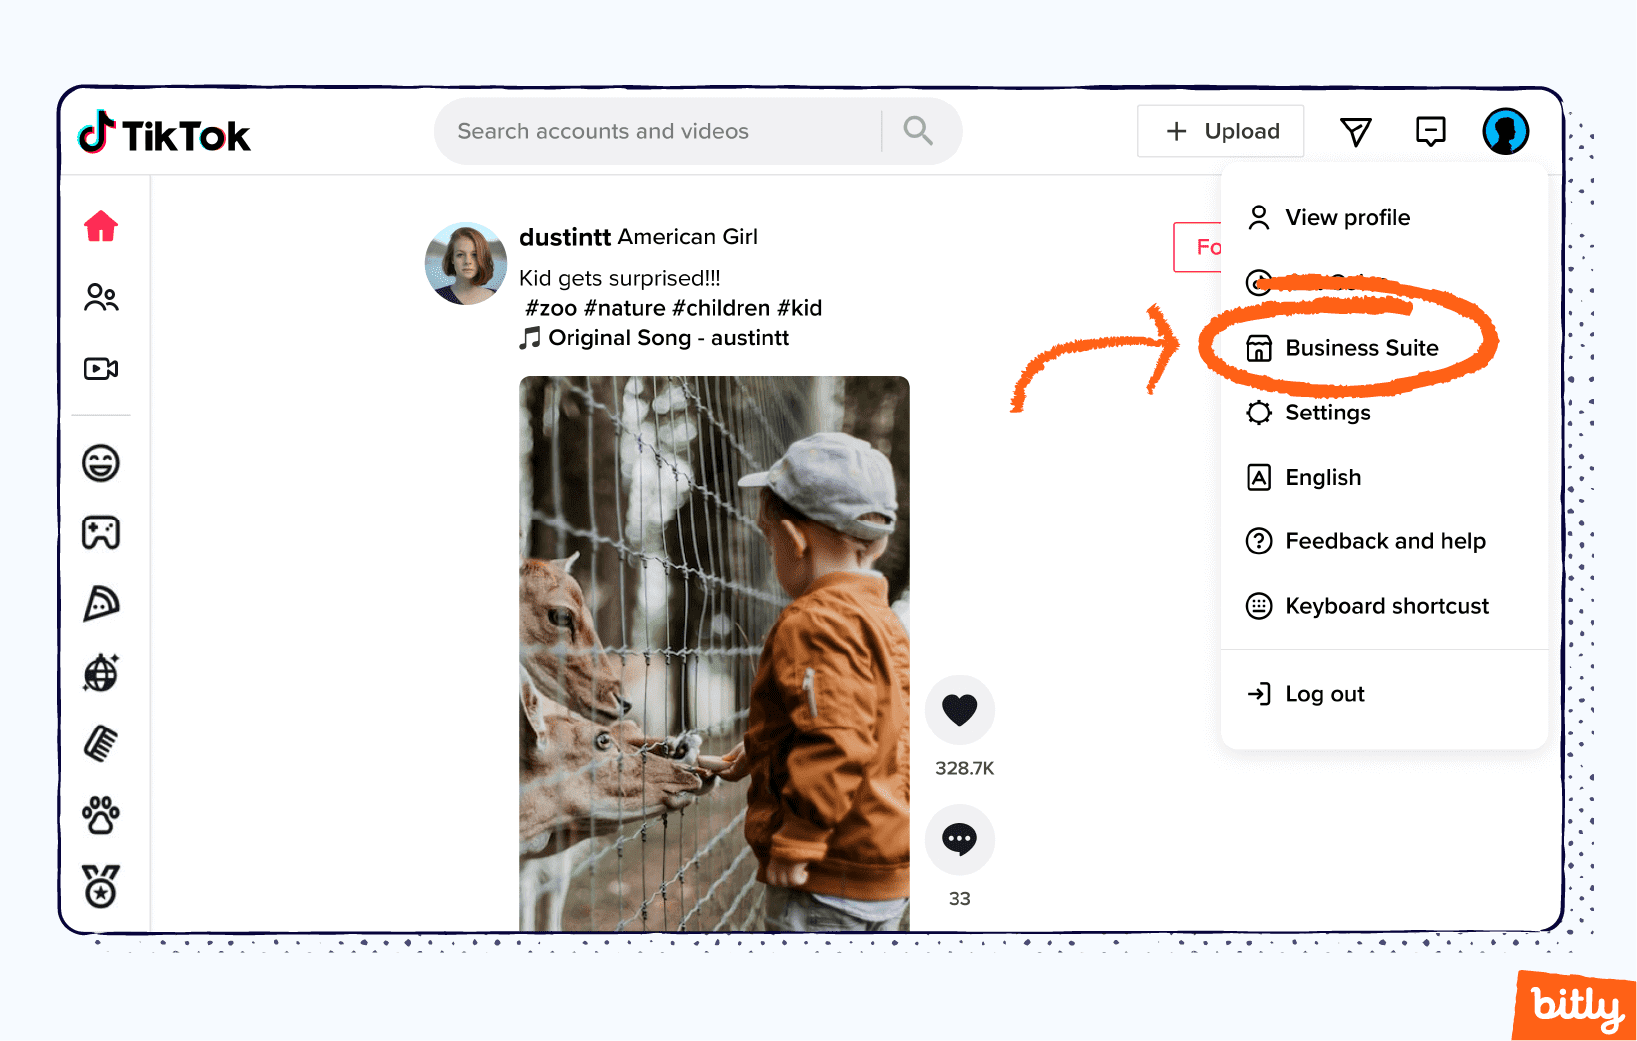
- Visit www.tiktok.com on your web browser and hover over your profile image on the right. Select Business Suite.
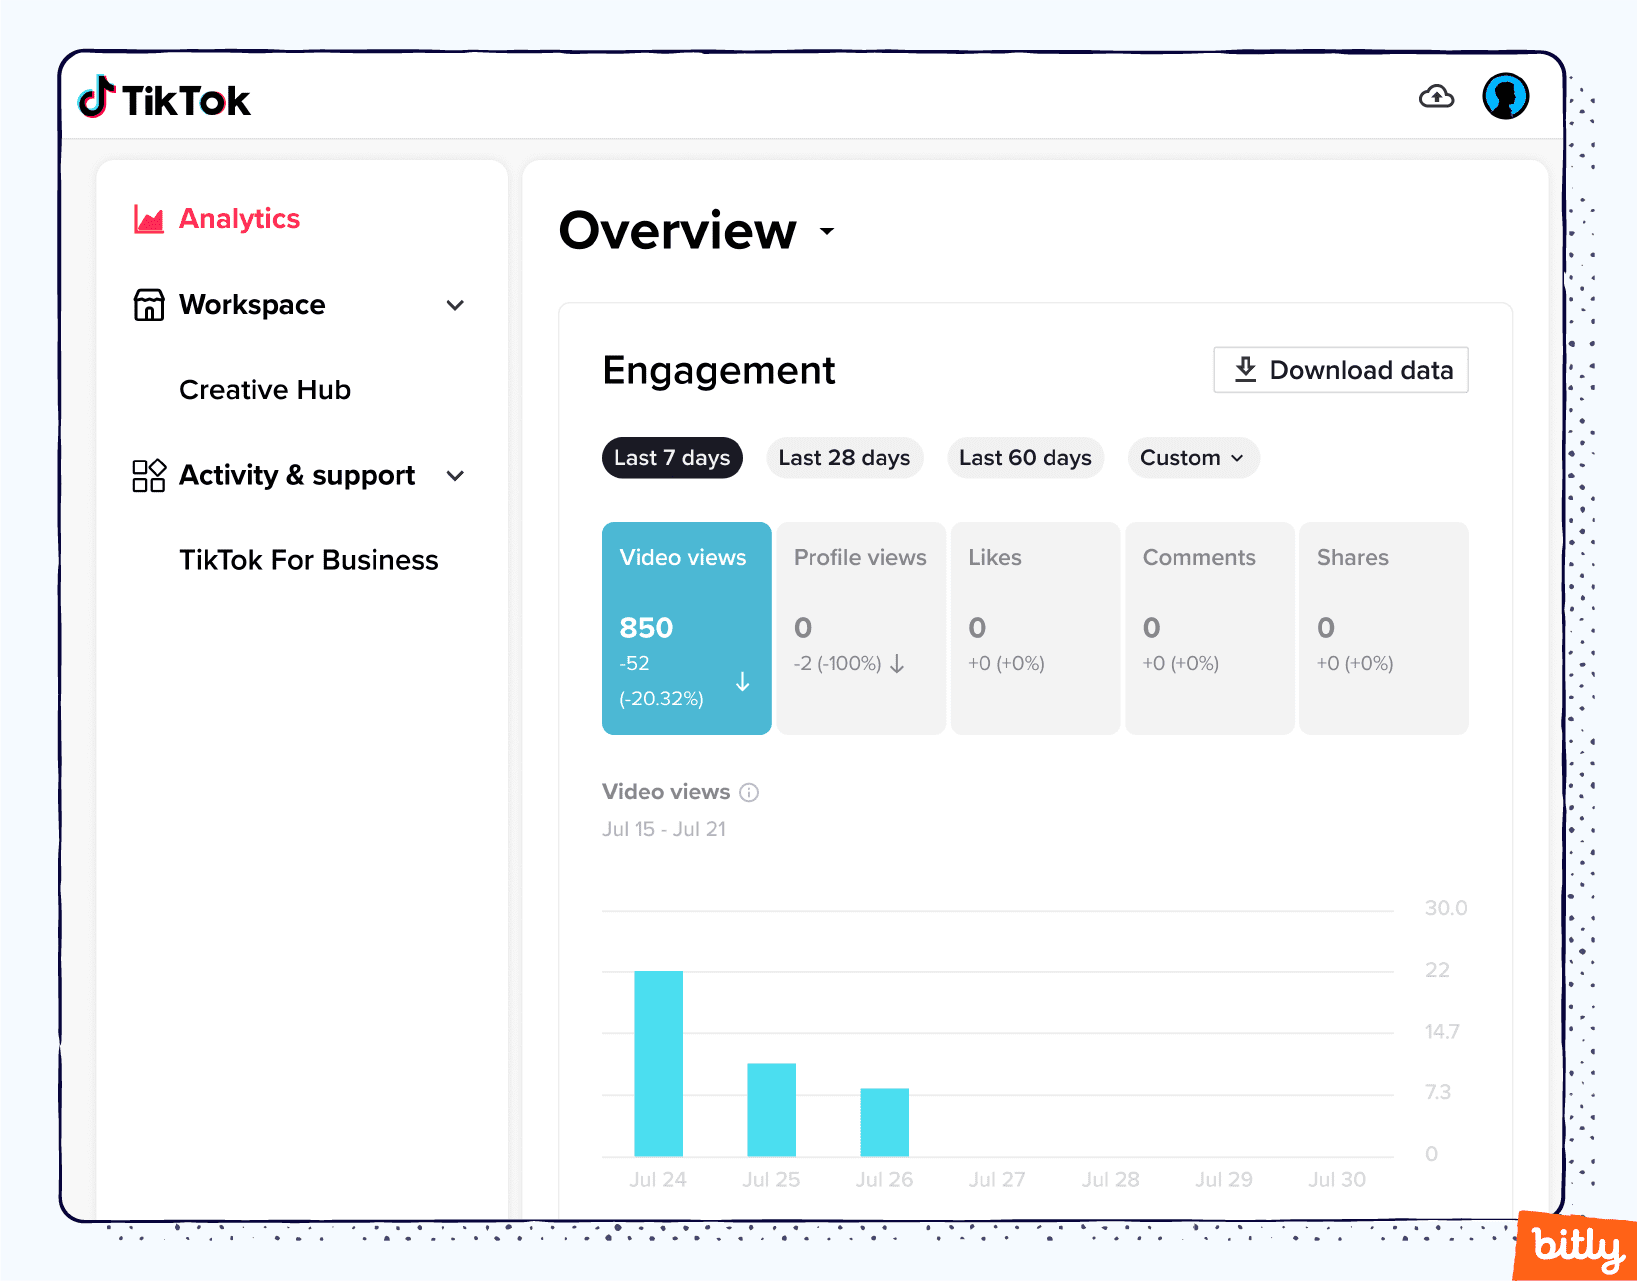
- You will now see the Overview section of analytics.
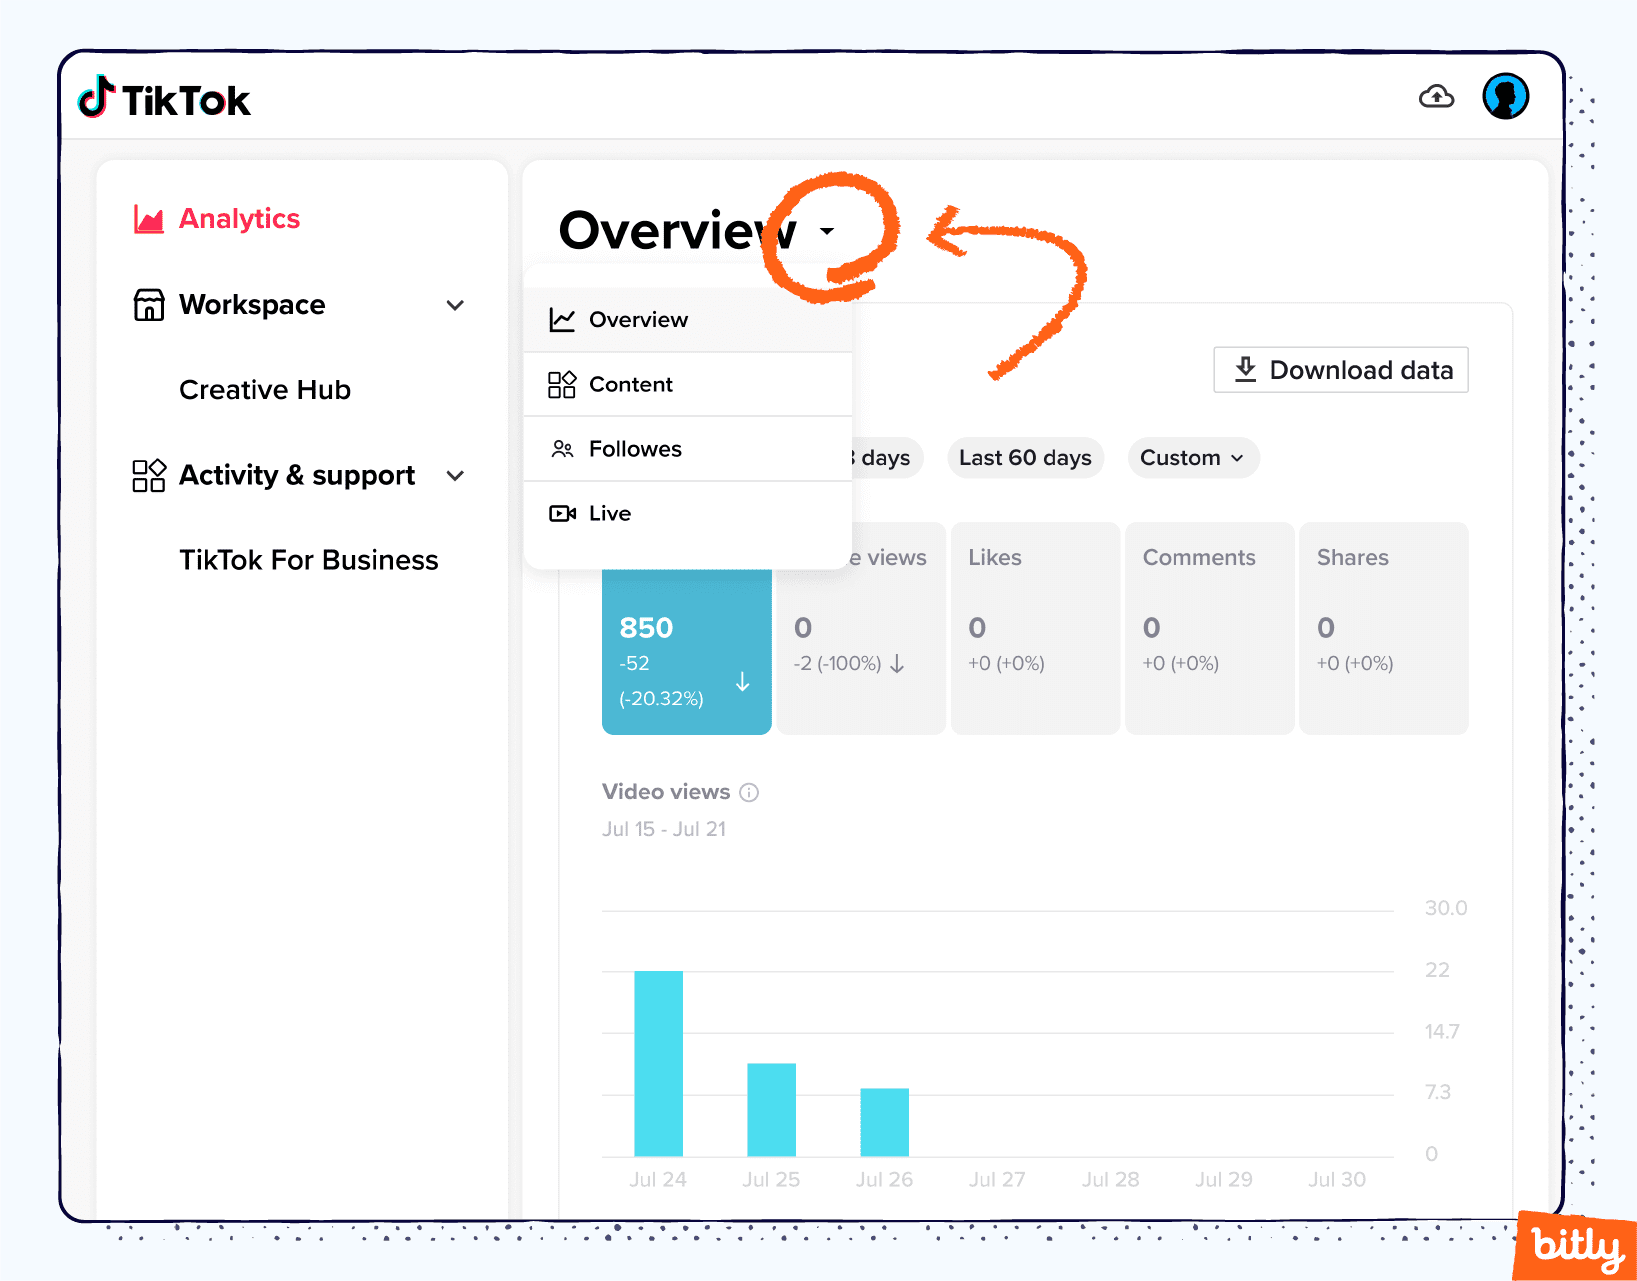
- Tap the downward arrow next to Overview to open a drop-down menu. Select a category (Overview, Content, Followers, or LIVE) to explore more.
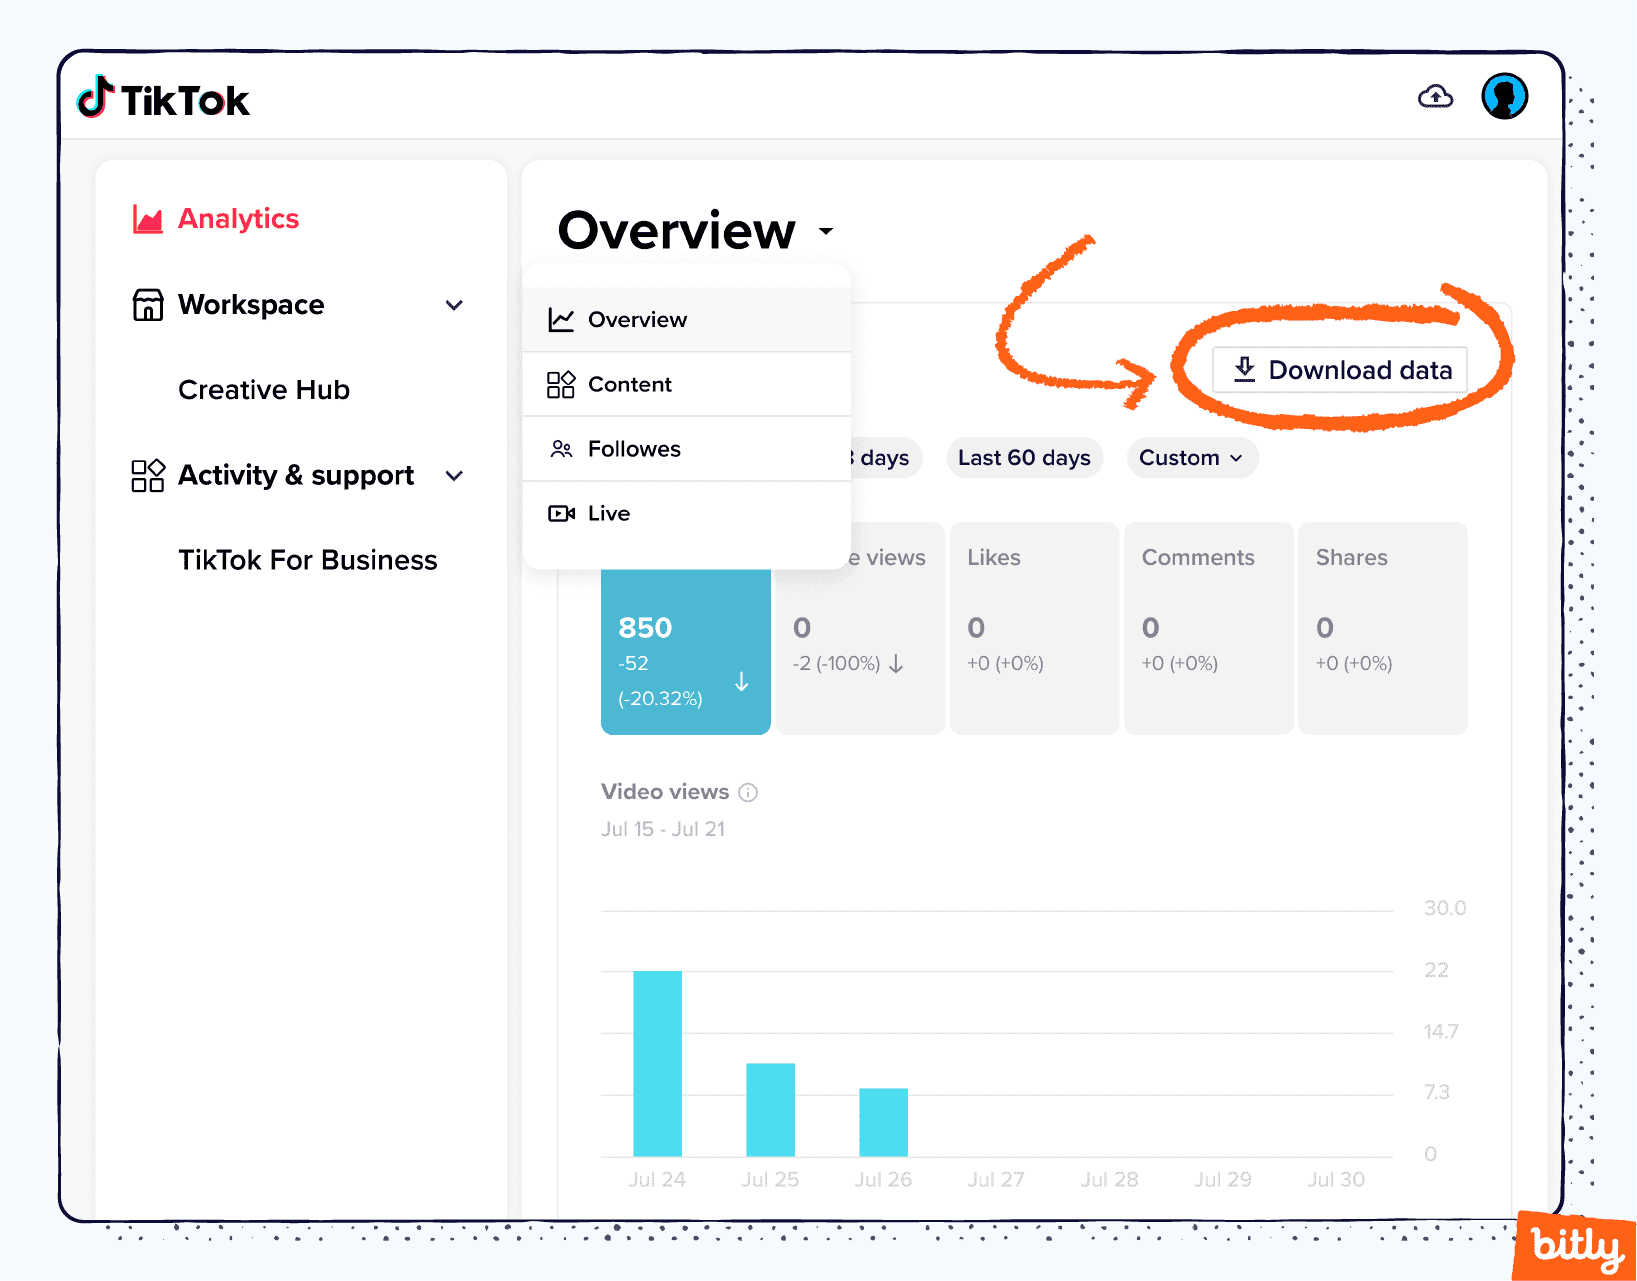
- On the desktop analytics section, you can download data to an Excel (XSLX) or CSV sheet. Navigate to the metric of interest and click Download data.
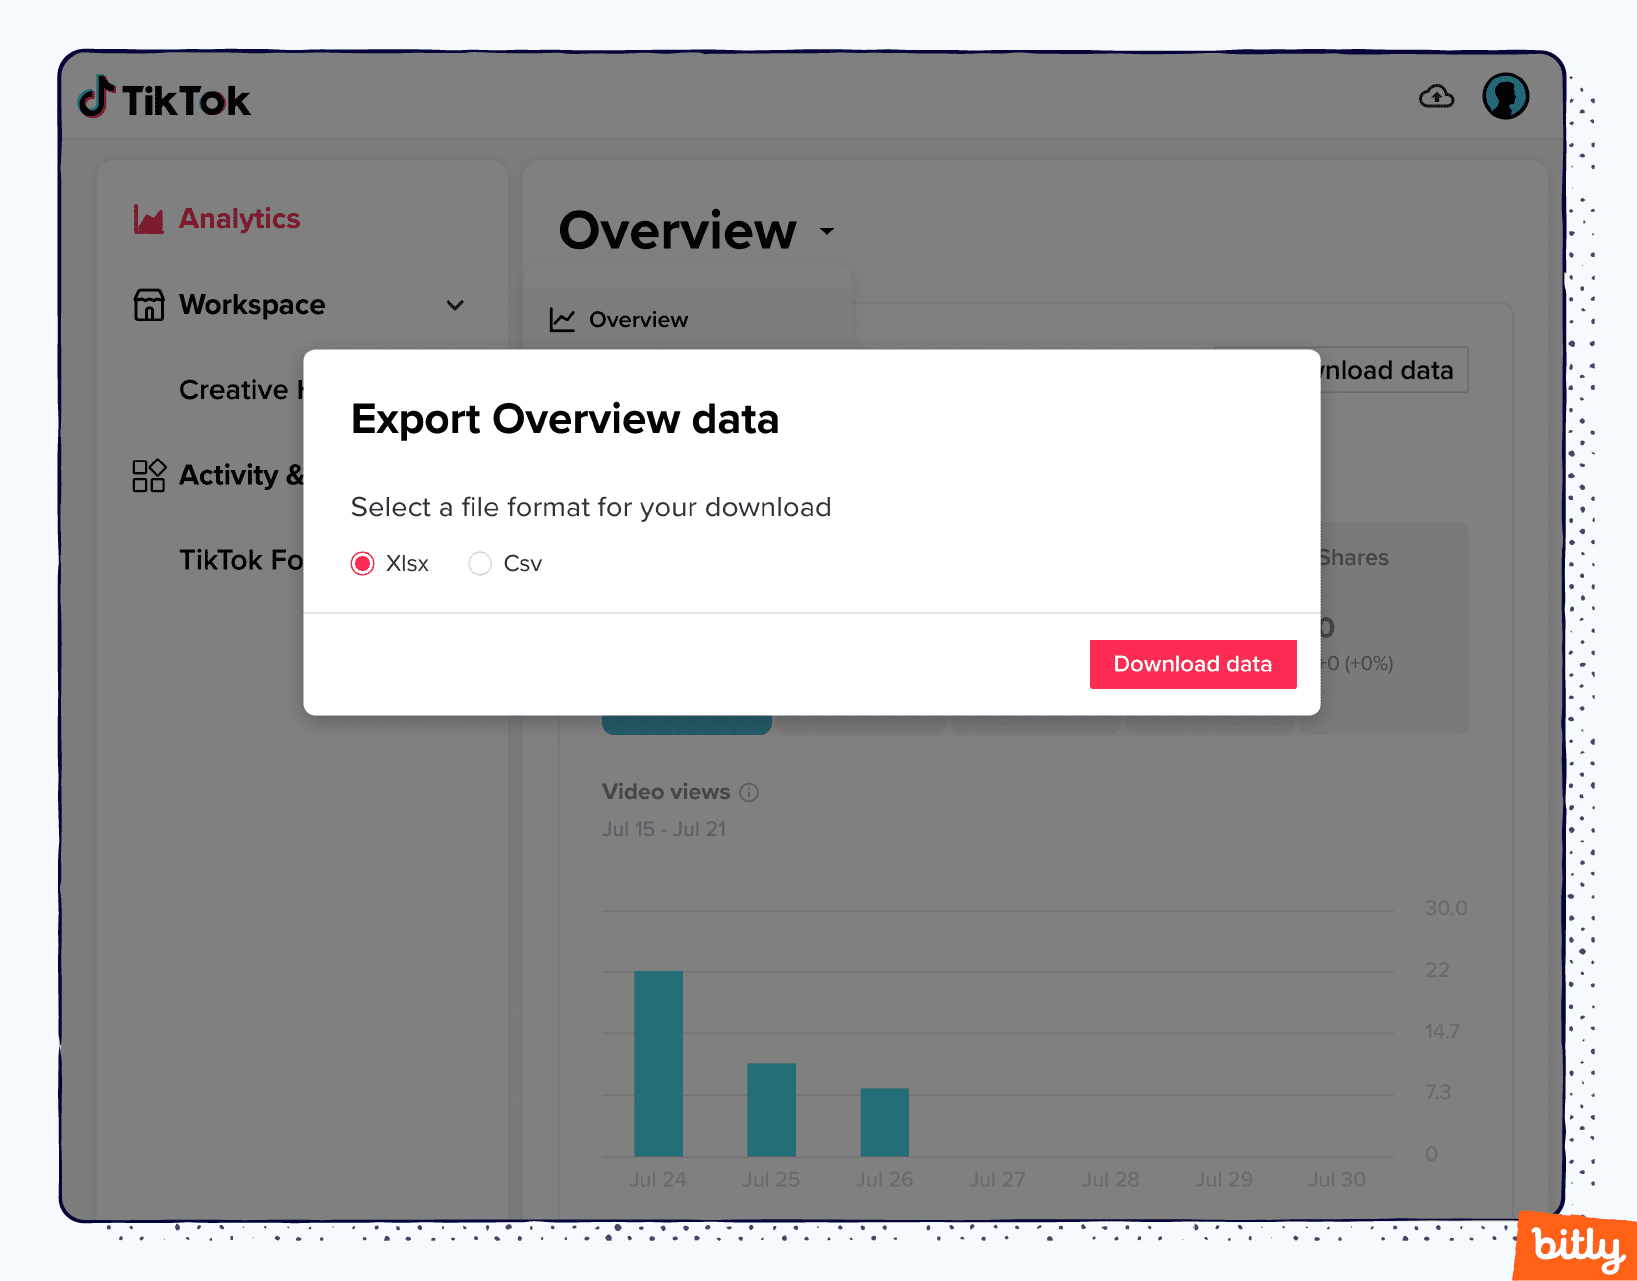
- Select a file format for your download and click the Download data button.
Types of TikTok Metrics
TikTok organizes analytics into three sections: Overview, Content, and Followers. You can track views, engagements, viewer stats, and more. Use this data to track video performance and learn about your followers.
The following sections detail the metrics TikTok provides in each category. Click the “i” in a circle next to a metric for more data.
Overview Analytics on TikTok
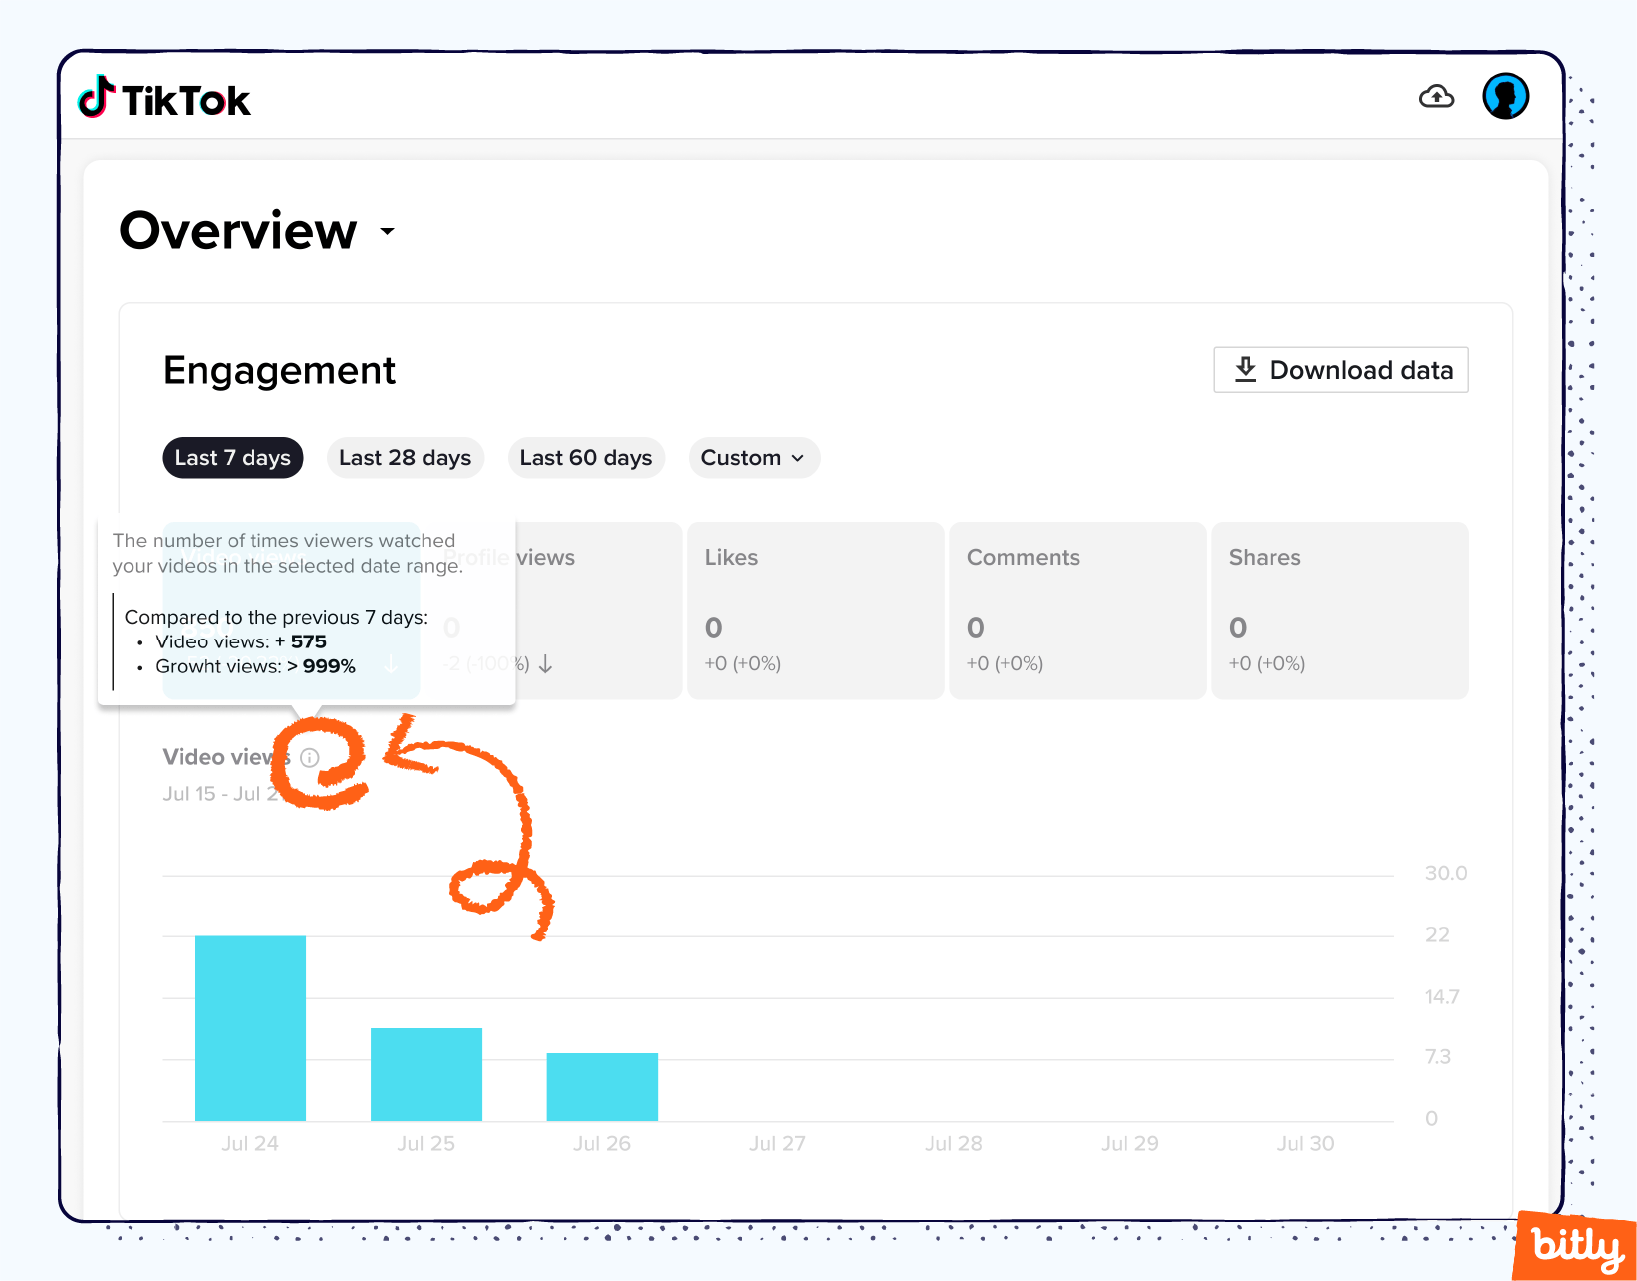
The overview section provides data on profile views, video views, likes, comments, and shares. These metrics help you get a general sense of your content’s performance. You can see analytics from any custom period between 7 and 60 days.
Here’s a list of vital overview analytics and how they can help you improve your TikTok campaign:
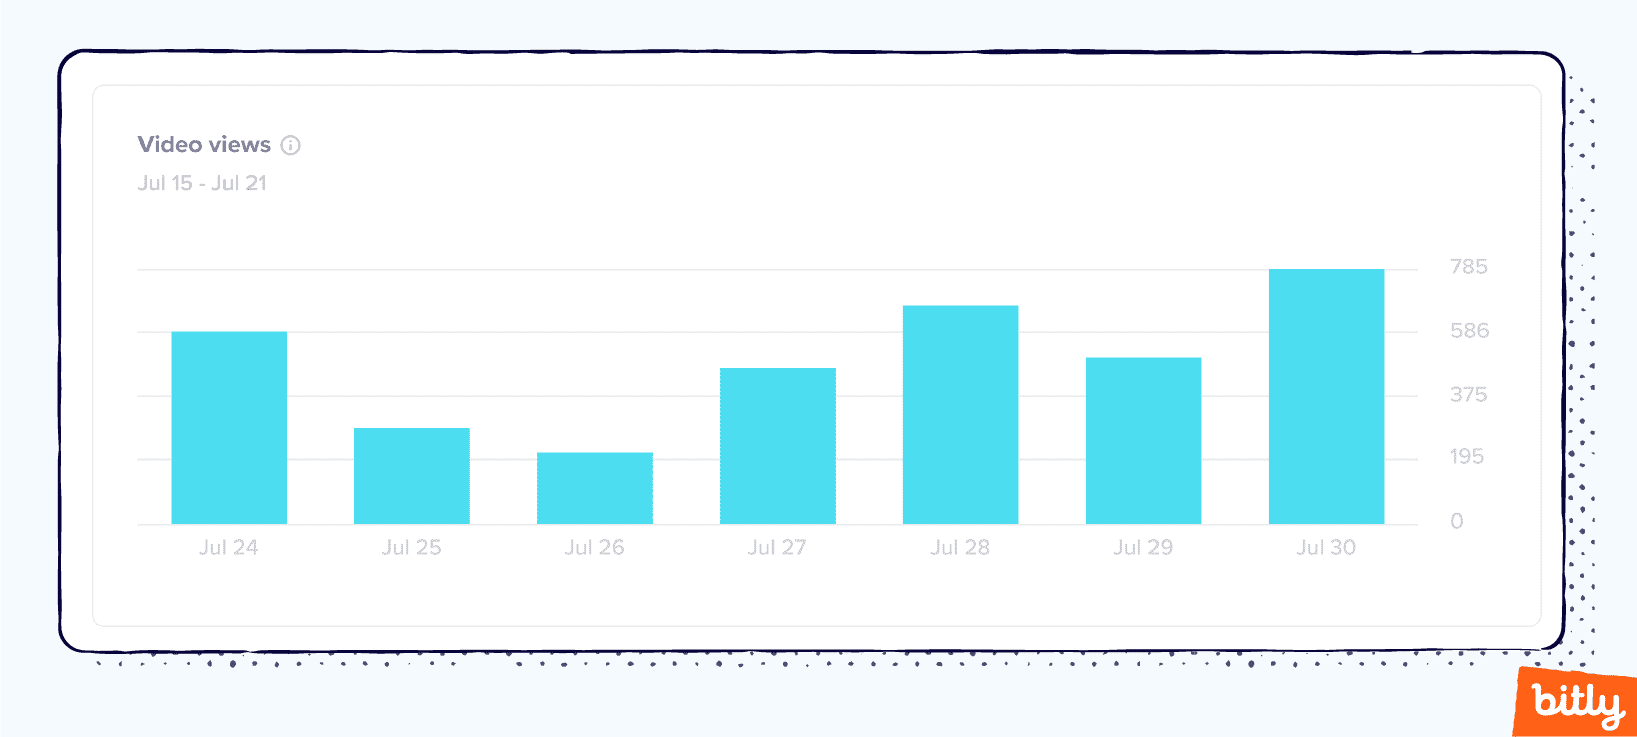
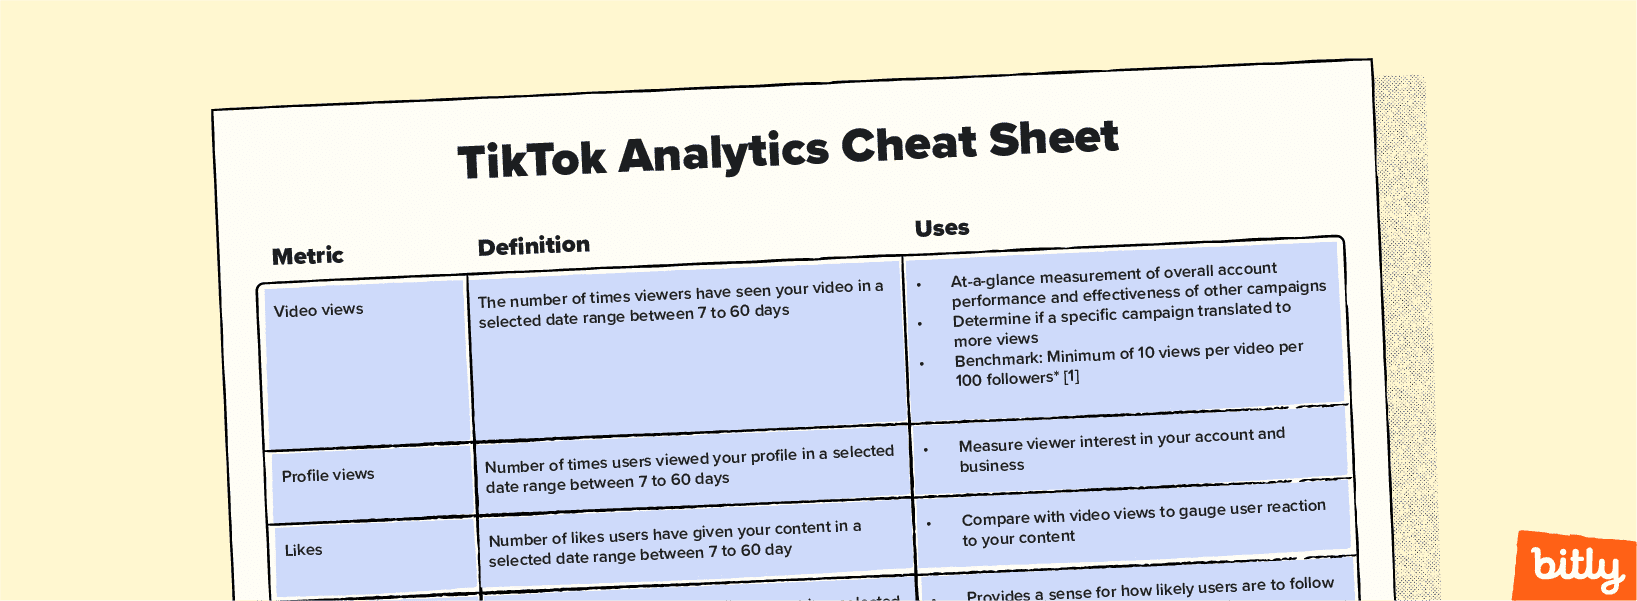
- Video views
The number of times viewers have seen your video in the date range. The video views graph provides an easy-to-interpret visual that you can use to see if your content has become more popular over a specific date range.
If you’re trying to gauge the success of a marketing campaign, you can restrict the dates so it covers the weeks after your promotion. Then, you can see if your efforts elsewhere translated to increased video views.
How many video views should a business aim for? Social analytics company Rival IQ studied 1,200 different TikTok business accounts that contained over 73,000 videos with 20.4 billion views. According to their study, the average brand earned about 17.6 views per 100 followers. Poorer performing brands earned 10 or fewer views per 100 followers. The data also revealed an interesting trend: The larger the number of followers, the lower the views per follower. For example, brands with between 200,000 and 1 million followers average just 7 views per 100 followers on each video. This trend may be because smaller accounts post less frequently. Consequently, viewers have fewer posts to select from, driving up the views per video.
Rival IQ also analyzed the data based on industry. The company reported that health and beauty had the top rate for views per follower, whereas nonprofits, retail, and tech companies had far fewer. Ideally, you would compare your company’s performance with competitors in the same industry. However, since this data may be difficult to find, aiming for a minimum of 10 followers per 100 videos can serve as a useful benchmark.
- Profile views
The number of times users viewed your profile in the selected date range. Profile views help you see whether users show interest in your brand or business as a whole rather than a single video.
You can also use profile views to gauge how your account performed after you posted a specific video—so long as you posted it within the last 60 days. - Likes
The number of likes users have given your content in the date range. When you compare video views with likes, you can determine whether people find your content favorable or not. - Comments
This stat represents the number of comments on your content in the date range. Comments and shares represent the most time-intensive form of engagement. If users stop and comment or share your content, you know they are interested in your channel and will likely follow some calls to action, like visiting the link you place in your bio.

Alessandro Bogliari, CEO & Co-Founder of The Influencer Marketing Factory, encourages his clients to “use the comment section on TikTok as your next focus group. Real feedback from real people is very valuable, especially for businesses looking to see if a product is popular or not.”
- Shares
This metric is the number of times your content was shared in the given date range.
The Influencer Marketing Factory’s Bogliari says, “I’m a big fan of shares as a useful metric. If someone took the time and effort to share a video, it means that either the content is very entertaining or very valuable—like a recipe or a trip idea. Together, content that attracts shares and comments, as opposed to only likes, is definitely something your audience likes and wants more of.”
Likes, comments, and shares all contribute to your engagement rate. Learn more about benchmark engagement rates.
Content Analytics in TikTok
Content analytics provides more precise insight into each video you post. You’ll find data like total time watched, average time watched, video views by region, and more.
TikTok only makes content metrics available for the last seven days. Regularly export the seven-day stats to an Excel sheet for long-term tracking of TikTok data, so you can easily combine all your data and analyze it collectively.
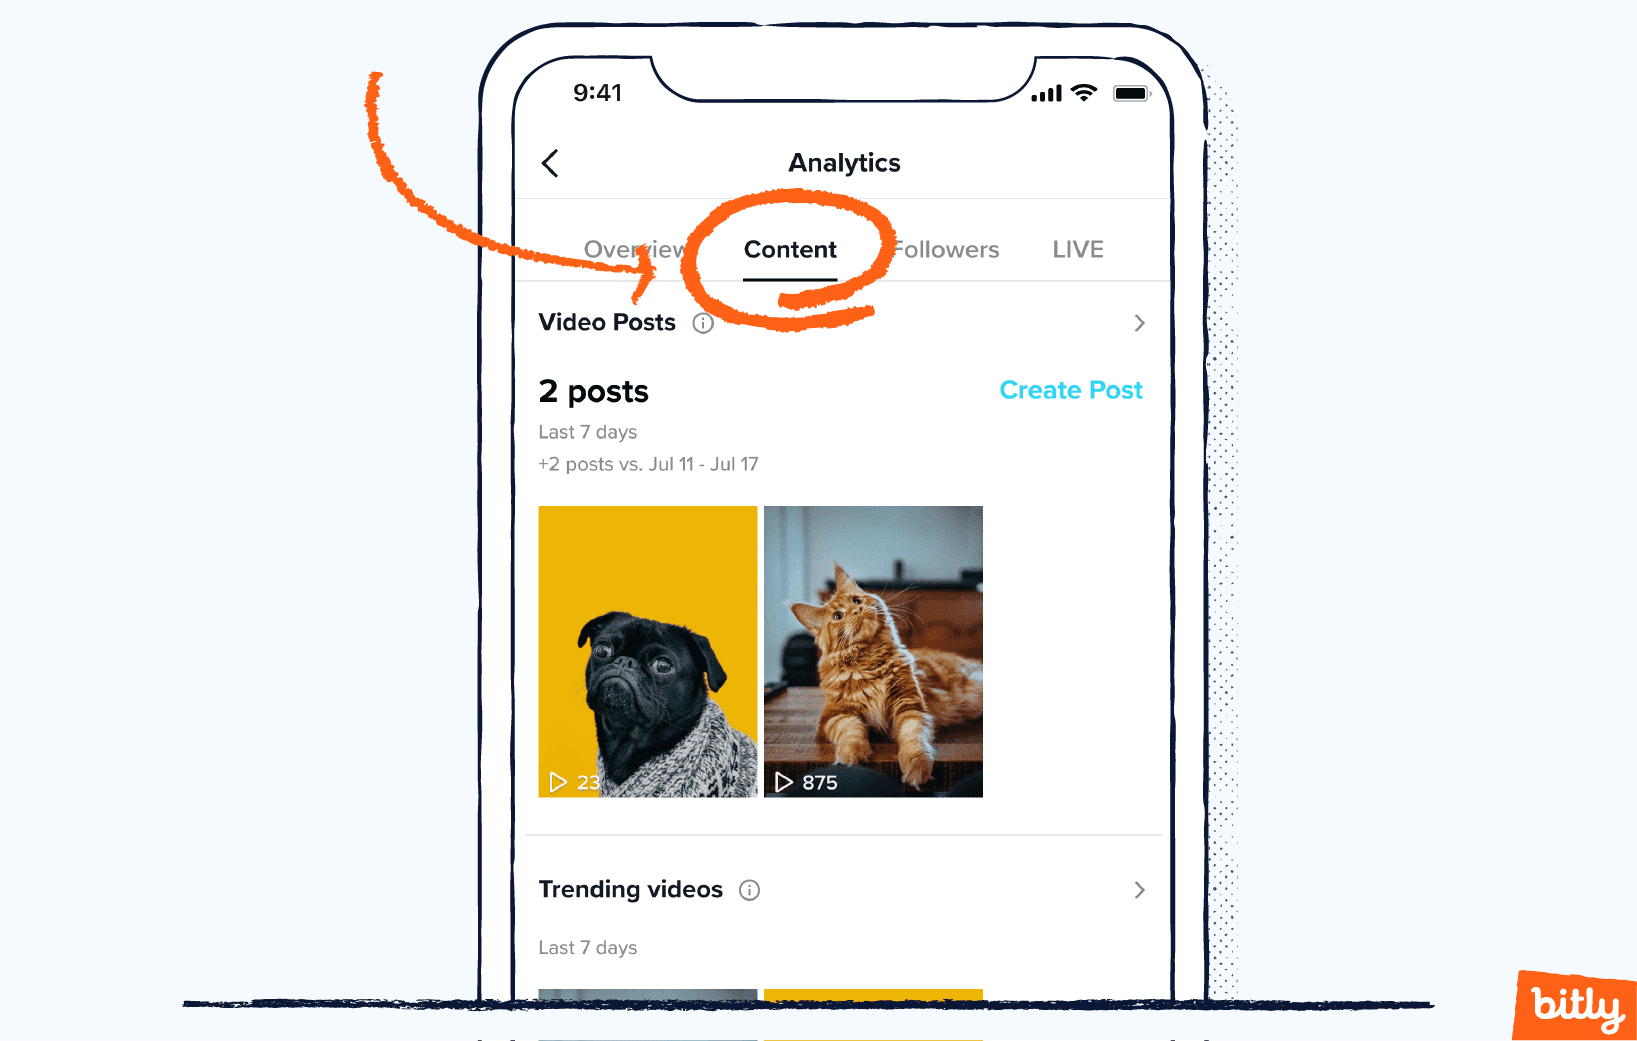
On both the mobile and desktop versions of TikTok, the content analytics page shows thumbnails of your videos from newest to oldest. You’ll also see information on the time and date, in your local time zone, that you posted the video. Click Trending videos to see the top nine videos, in order of growth rate.
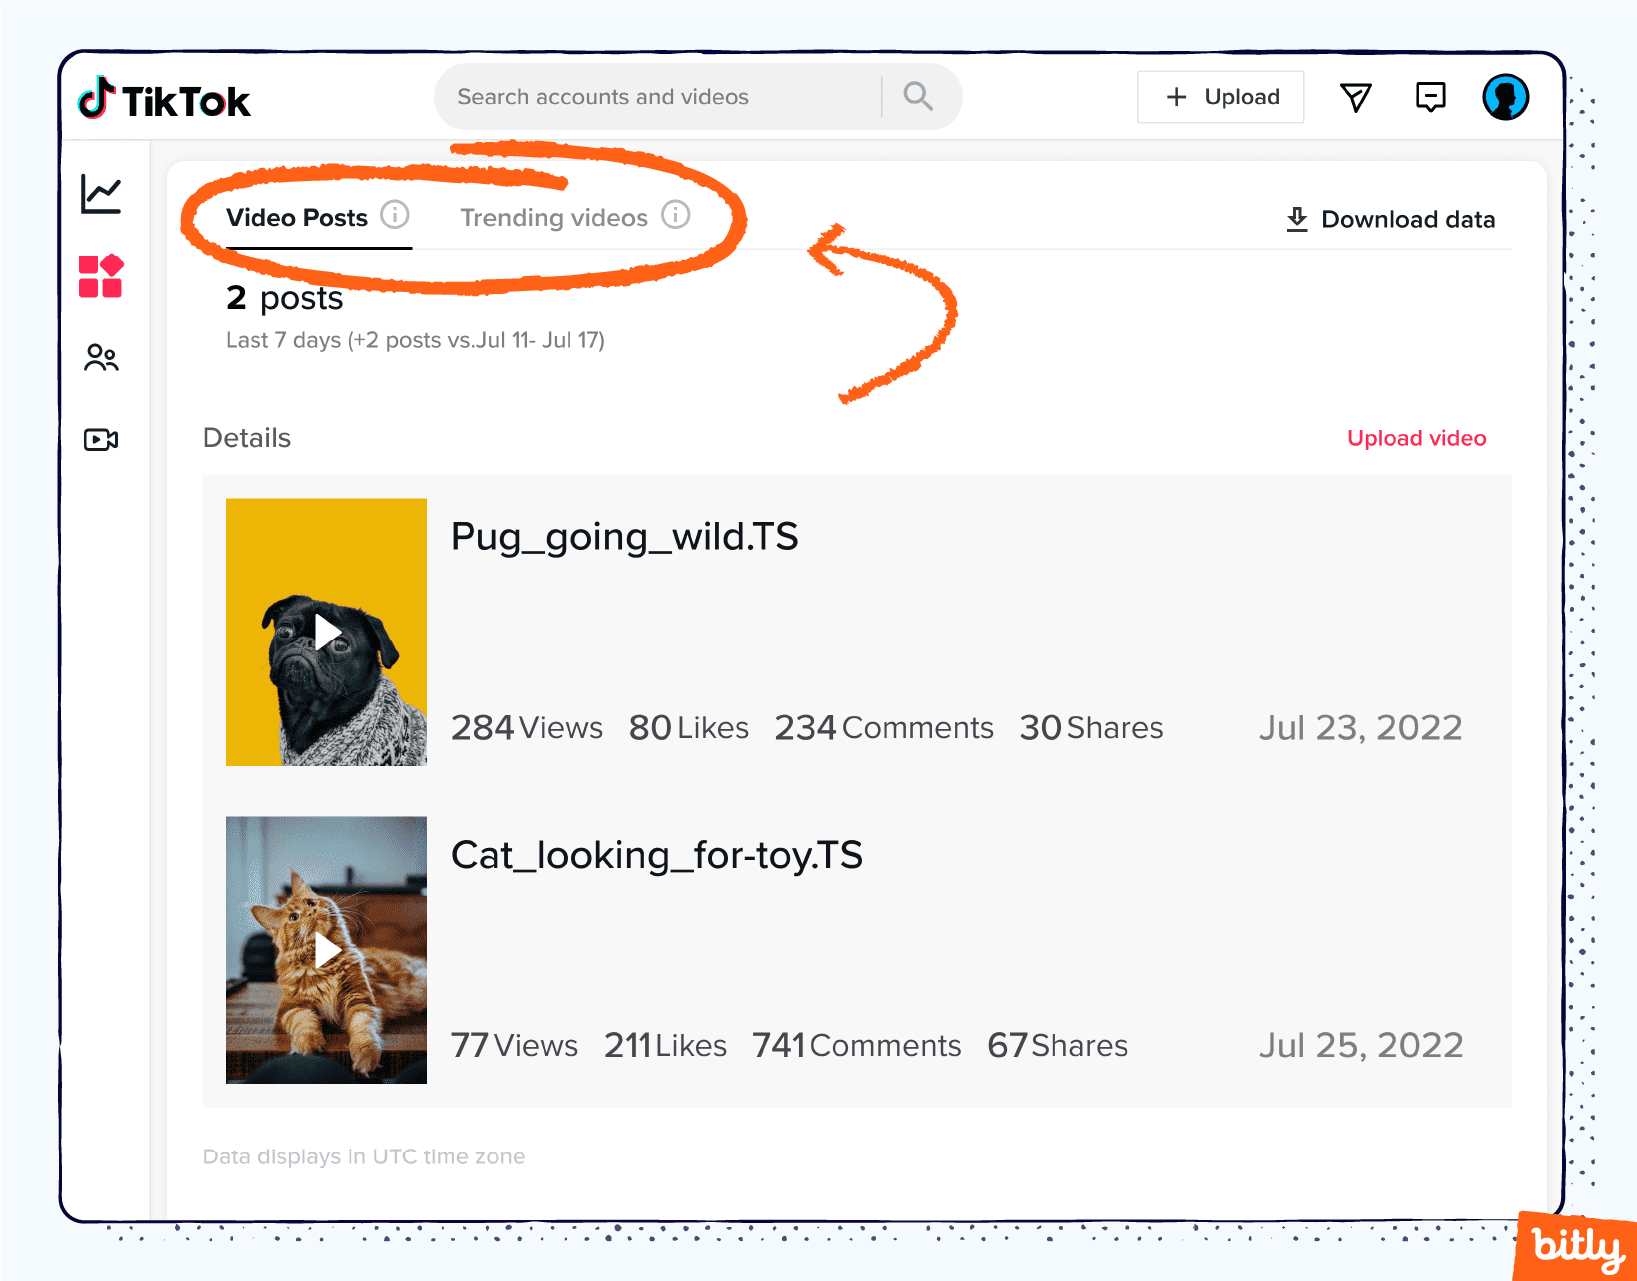
To get analytics for each video, tap or click on the video of your choosing. Note: TikTok only provides content data on posts you uploaded after becoming a business member.
You will see the following metrics per video:
- Overview
Click on a video’s thumbnail to see the number of views, likes, comments, and shares. You will also find the post time displayed in your local time zone. This at-a-glance information can help you compare videos quickly to see which ones have the most views, likes, comments, and shares.
Pay special attention to the videos with the most comments and shares. Viewers who comment and share video express high levels of interest in your content and, indirectly, your business. Study these videos and try to adopt their elements into future content.
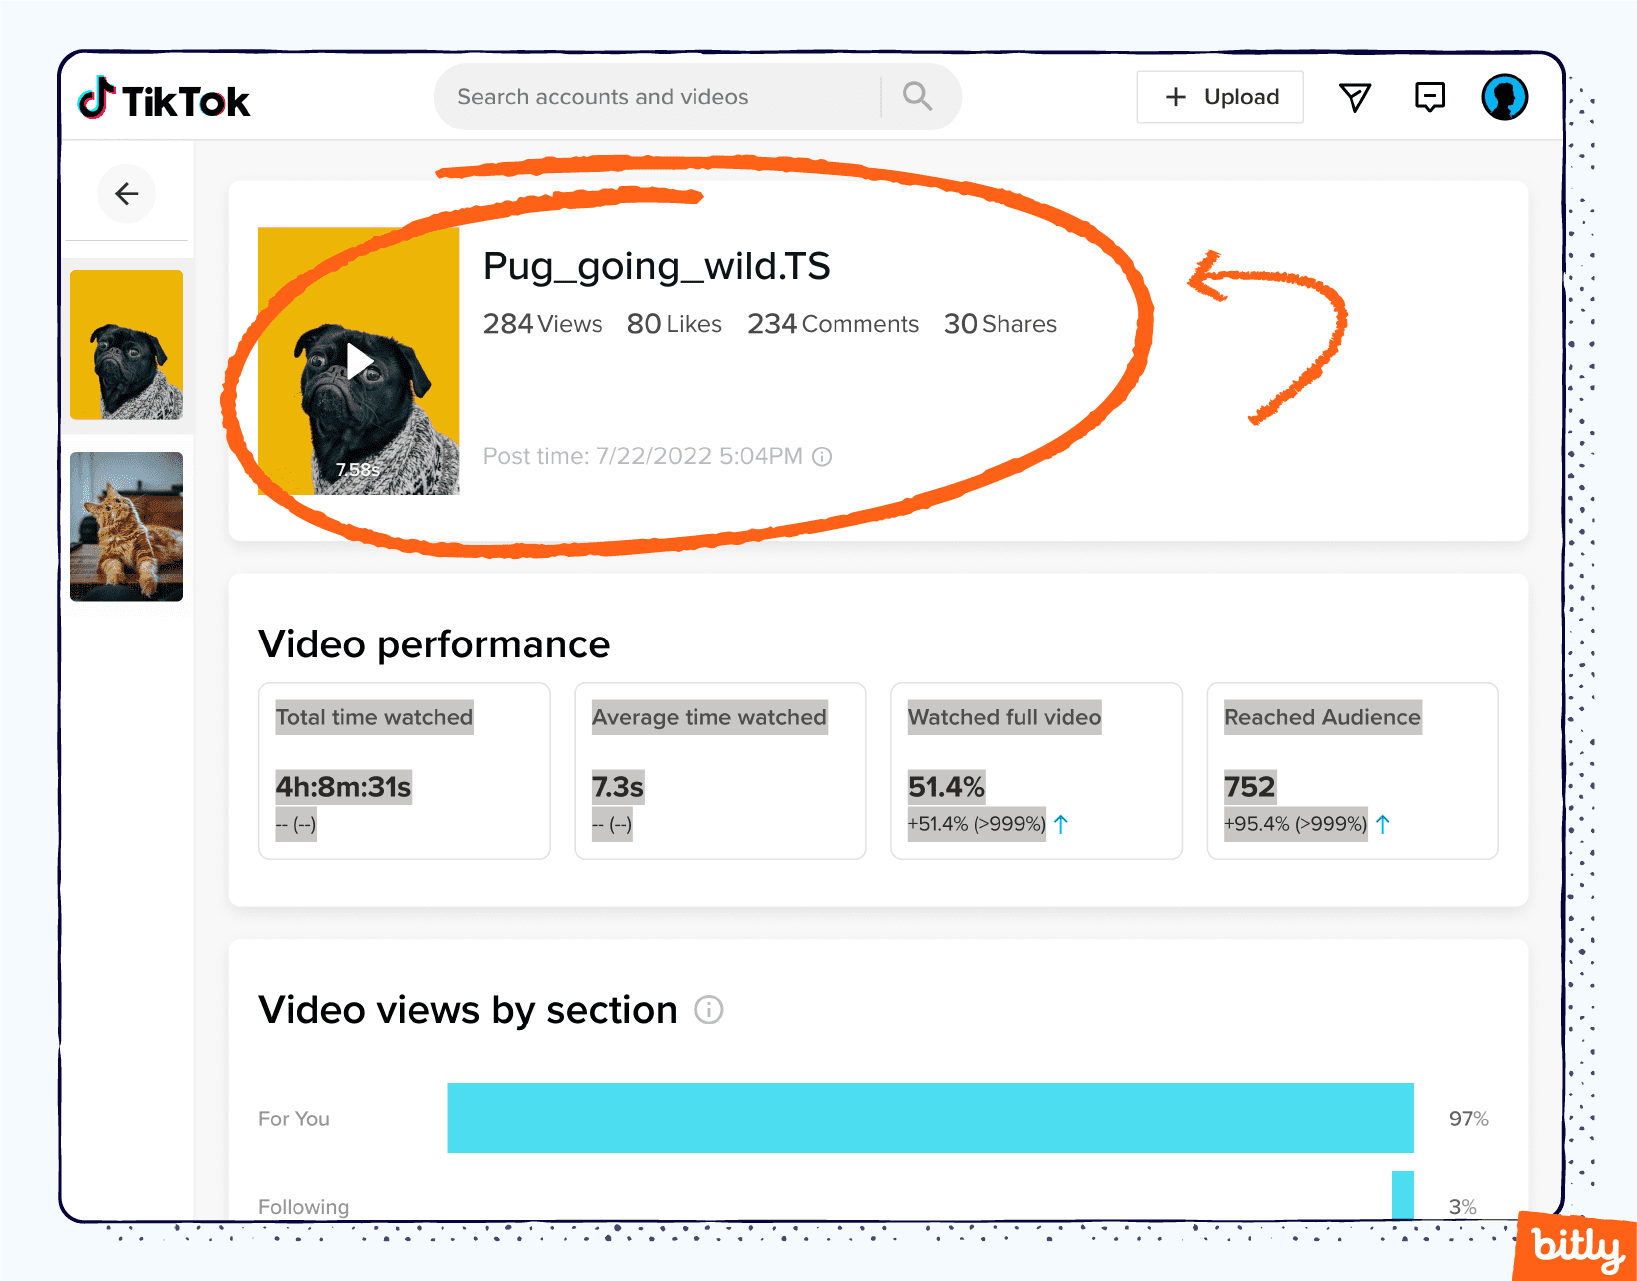
- Video performance
The video performance section includes six metrics:
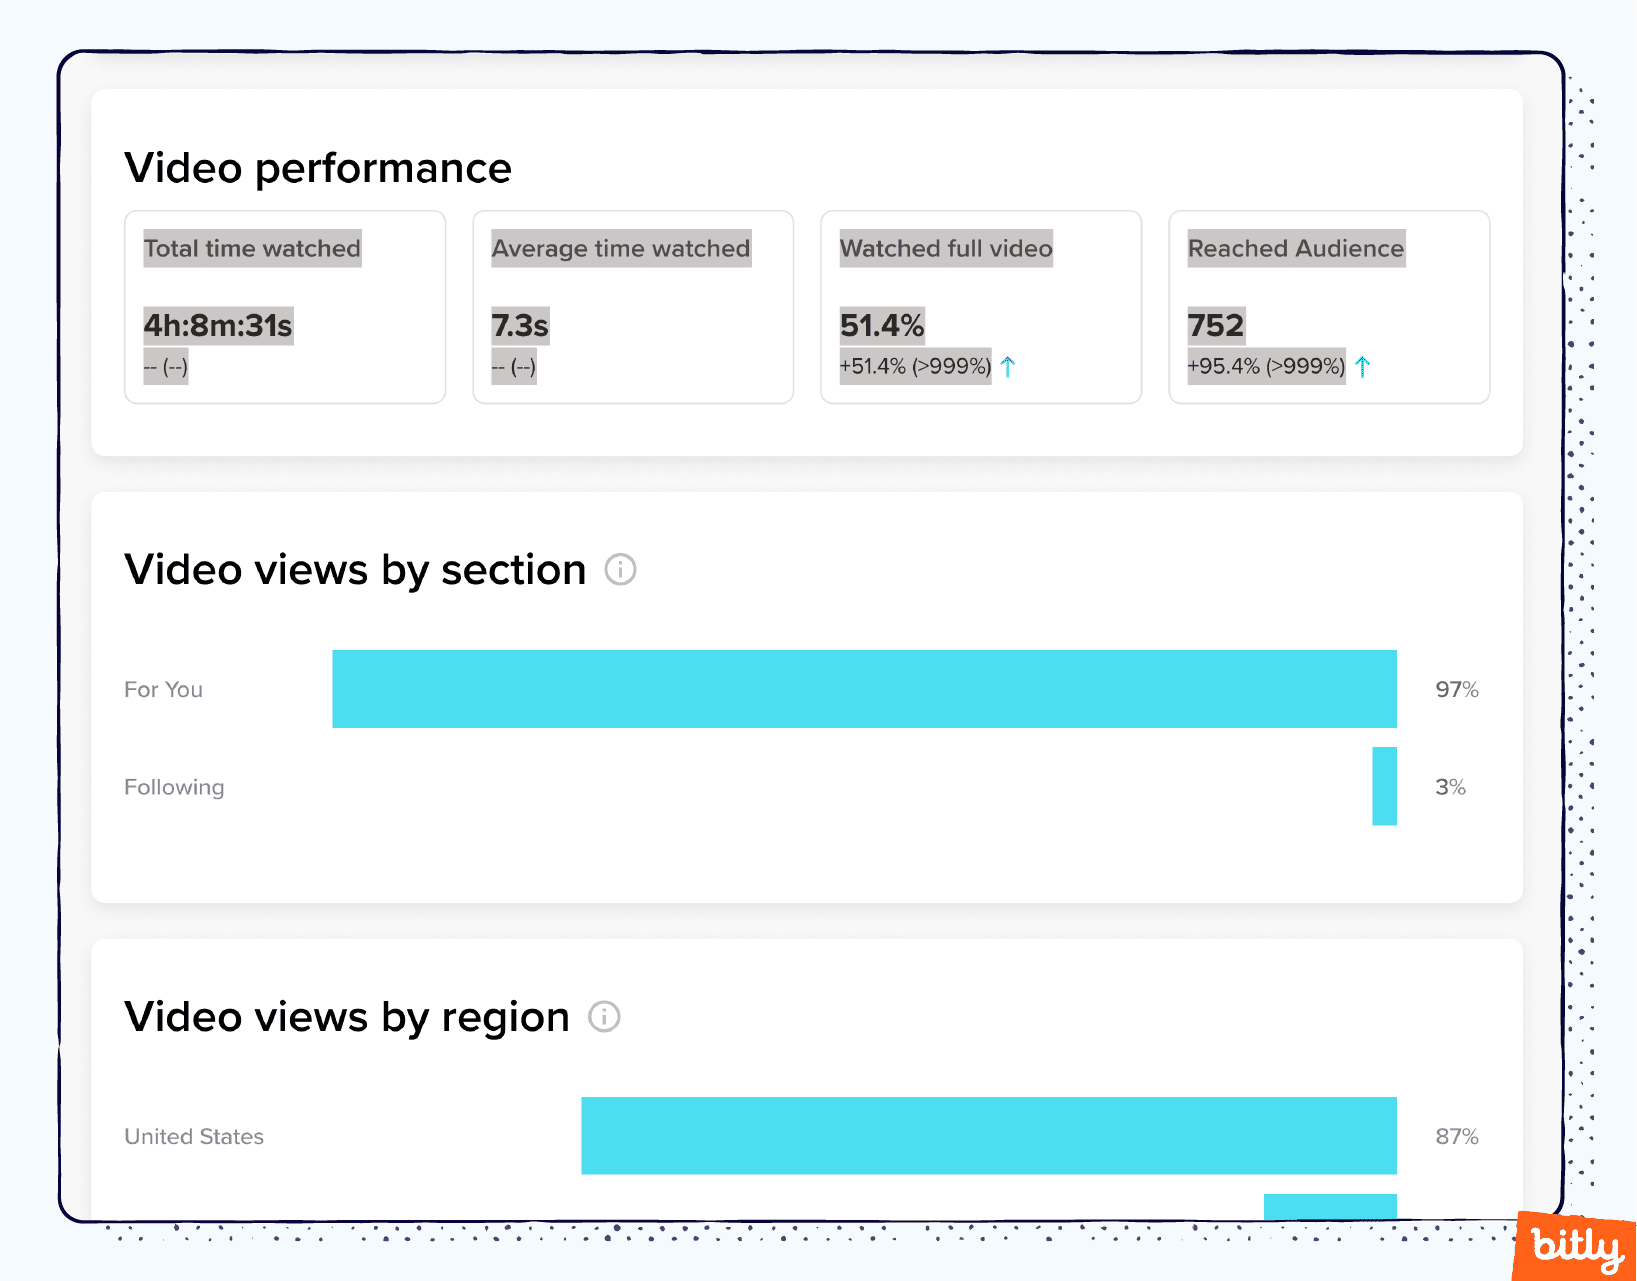
- Total time watched
This number is the cumulative total of the time users have spent watching a video. An individual post’s play time does not reveal much on its own. You can compare the total time watched of your videos to determine your account’s average total play time.
- Average time watched
This stat represents the average amount of time users spend watching your video. The average time watched can be a hard statistic to analyze meaningfully because it can vary dramatically based on video length. Shorter videos will have a higher average time watched. One way to assess this metric is to convert it into a “percentage of video watched.” For example, a user who watches 10 seconds of a 20-second video becomes disinterested 50% of the way into the video.
We don’t have robust data that has analyzed this metric across businesses, but TikTok’s algorithm favors videos with high average watch times. The higher your average watch time, the more likely TikTok will recommend your content to other viewers.
To increase average watch time, identify common elements in videos with high percentage watch times. Then, try to incorporate these features into future content.
- Watched full video
This number is the percentage of users who watched the entire video and captures whether the video keeps a viewer’s attention or not. Again, TikTok likes videos with high average watch times. If many users watch your full video, your content will be more likely to land on another user’s For You (the feed of videos that appears when you open TikTok) page.
- Reached audience
This counts the number of unique users who viewed your video. This data gives you a clearer picture of the actual number of individuals engaging with your content and deflates any falsely high numbers resulting from duplicate views from the same account.
- Video views by section
This metric organizes your video traffic based on its source. These sources include the For You feed, your profile, sounds, hashtags, and searches.
This stat can be extremely helpful in determining where your followers hear about you. For example, if you want to use hashtags to drive engagement, you can look at this metric to see which hashtags drive organic traffic.
- Video views by region
This shows the locations of viewers for a given video post. You can check this data to see if any region-specific campaign reached your intended audience or discover a new area you should be targeting.
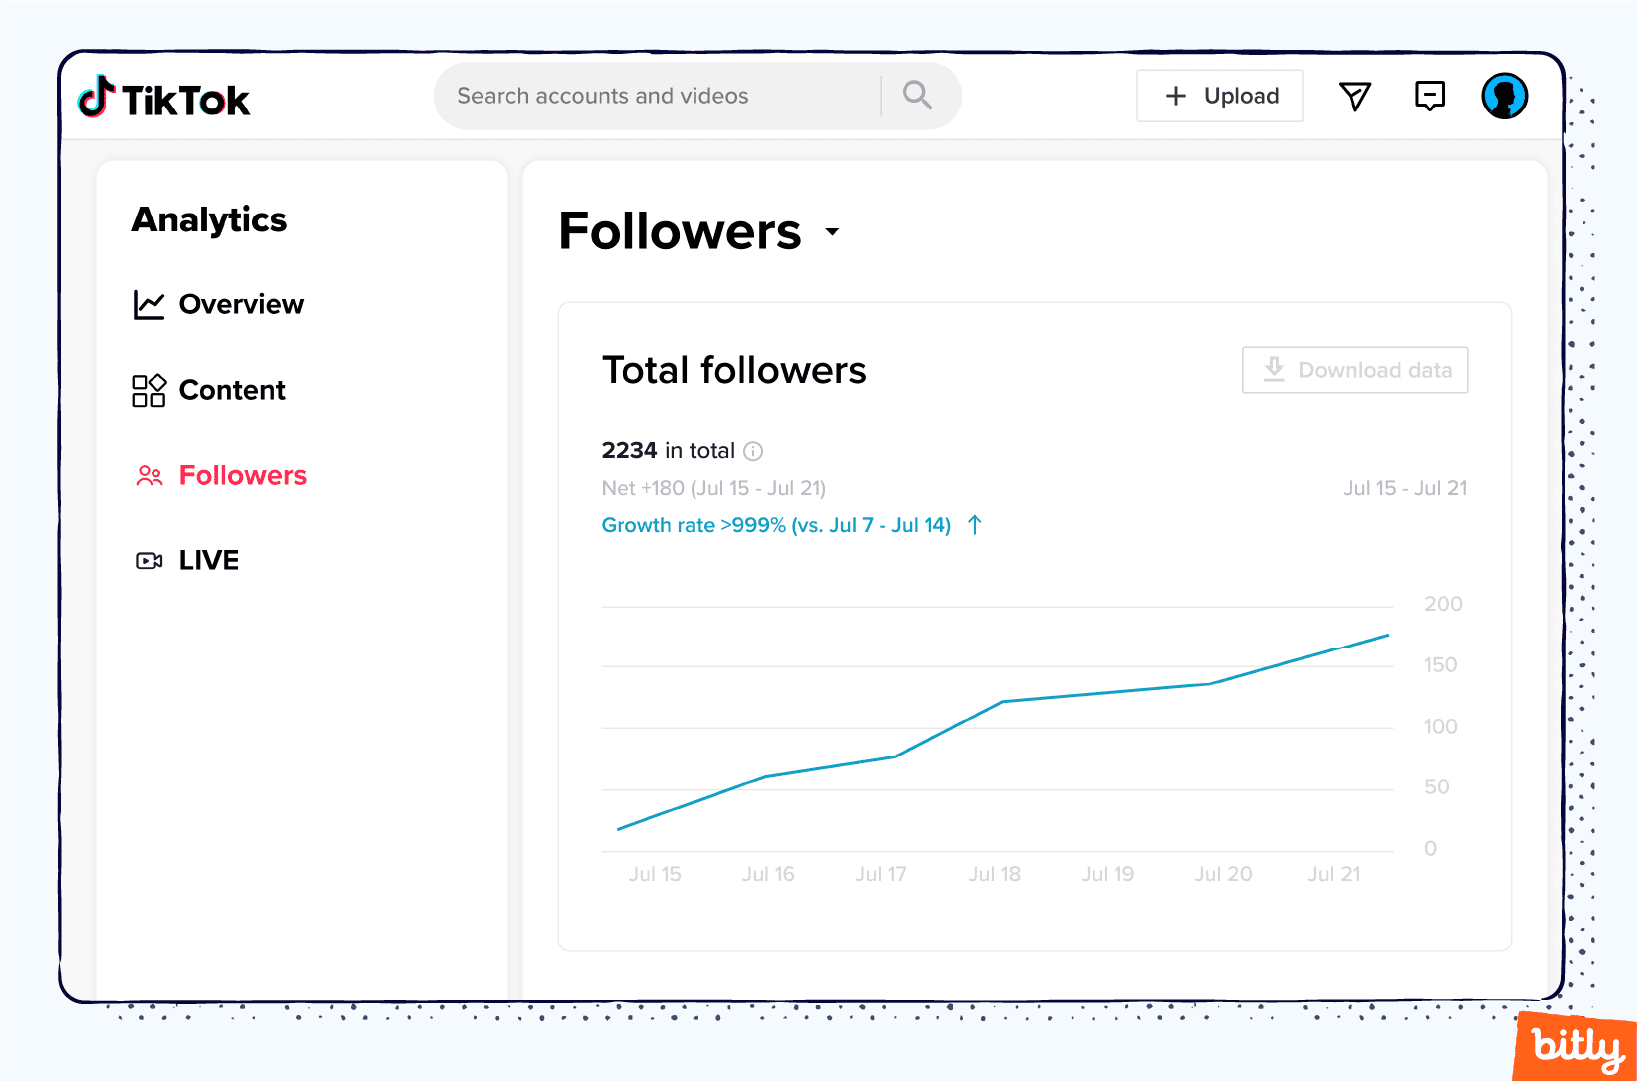
Follower Analytics on TikTok
Follower analytics offers insight into the users who follow you on TikTok. Here, you can learn more about their demographics. Also, TikTok shows data about what times they are most active.
Hannah Spooner, a social media strategist, believes:
 “Follower metrics can offer deep insight. TikTok has put more emphasis on followers lately by including notifications that prompt you to check out your follower feed. So, every user should pay attention to their followers. Learn when they are most active, what regions they’re in, and if they’re the main source of your video views. Your followers have already bought in on some level, so use TikTok’s data to help you strike a balance between discovery and nurturing the people who already like what you’re doing.”
TikTok provides four metrics on followers:
- Total followers
This metric is the total number of accounts that follow you. This section includes a graphic that shows the general trend of your follower account over a selected time period.
Hover over the “i” in a circle next to your total number of followers to see data on net followers; that is, the amount of new follows subtracted by unfollows. TikTok also displays the growth rate of followers over a selected period.
According to Rival IQ, brands across all industries show a follower growth rate of at least 2–3%. This growth rate did not vary significantly based on industry, a testament to the popularity and surging growth of TikTok.
You can toggle between the 7-day and 28-day trends to get an idea of how your follower count has changed. This metric can help you determine if popular videos translate to new followers, identify which videos bring in followers, and adopt elements of that content into future posts.
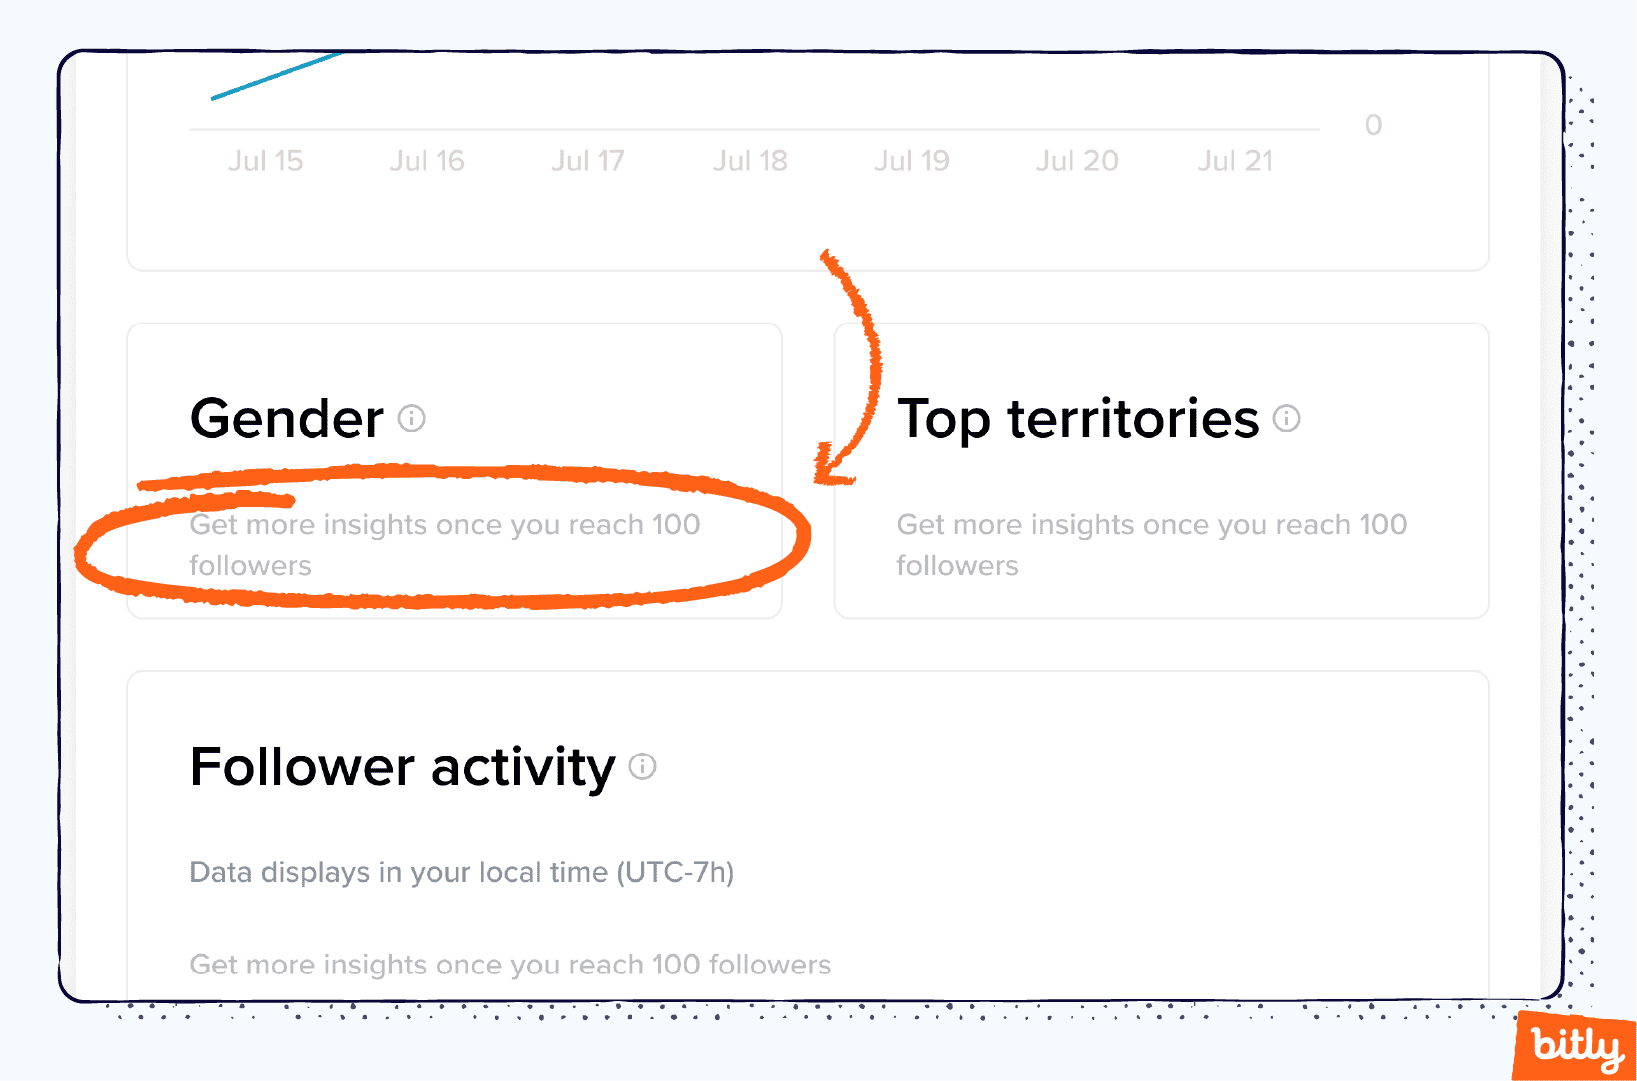
To get information on gender, territory distribution, and follower activity, you need at least 100 followers. Depending on your business campaign, some of these metrics might be important, and others might not be very revealing. For example, if you hope to gain more engagement in a specific region, paying attention to the “top territories” section will help you gauge the extent of your reach.
- Gender
This metric represents the distribution of your followers organized by gender and reveals if your business resonates more with women or men. If your business focuses on a service or product that targets one over the other, the gender demographics should reflect that audience. Or, if you hope for an equal split, you can watch this section and finetune your strategies.
Statista reports that, as of January 2022, women make up 57% of global users on TikTok. This statistic means that brands hoping to target men may have to work harder to market to this smaller audience. - Top territories
This data shows the distribution of your followers by territory. This section is useful for those considering running a region- or location-specific campaign. For example, if you have been marketing toward German clients and notice an uptick in followers from Germany, this distribution change could signify the campaign is effective. - Follower activity
Get a glimpse at the times of day (adjusted for your local time zone) when your followers are most active. This metric allows you to post videos when your followers are most likely to see and respond to them. You’ll want to post videos when your follower activity is consistently high.
In a 2022 survey of 100,000 TikTok posts, InfluencerHub reports that TikTok users are most active between 6:00 AM and 9:00 AM Eastern Standard Time (EST) and 7:00 PM and 10:00 PM EST.
LIVE Analytics in TikTok
Users who have posted live video streams can also access relevant data on these posts. This category has data on follower count, time spent live, total views, and how many Diamonds (a way viewers can show appreciation) you have.
- Total views
This metric is the total number of unique viewers present during your live videos.
- Total time
This number tells you the total time you spent hosting live videos. Check this section for a quick summary of how much effort you have placed in LIVE campaigns. Analyze this data with new followers, unique viewers, or Diamonds data to see if your energy investment translated into a worthwhile follower engagement increase for your account.
- New followers
This number is how many users began to follow you during a live video. Use this measurement to see if your live videos translate to increased brand awareness.
- Top viewer count
This metric tells you the most amount of viewers who viewed your live video at a single time.
- Unique viewers
This number is how many unique users viewed a live stream. Here, TikTok counts each viewer once, even if they viewed your video many times.
- Diamonds
The total number of diamonds users sent you. When a content creator hosts a live stream, viewers will see a gift box icon at the bottom right of their screen. When they click on the box, they can send a gift to support the creator. TikTok converts these gifts into “diamonds” and transfers them to the creator’s balance. You can withdraw diamonds for actual USD. One diamond is around $0.05. Keeping track of your total diamond number tells you how many viewers want to financially support your content—the ultimate sign of viewer loyalty.
Additional TikTok Analytics
You can use additional analytics to understand how other content performs on TikTok. Metrics like hashtag views and engagement rates reveal what performs well. Then, you can add elements of popular videos to your content.
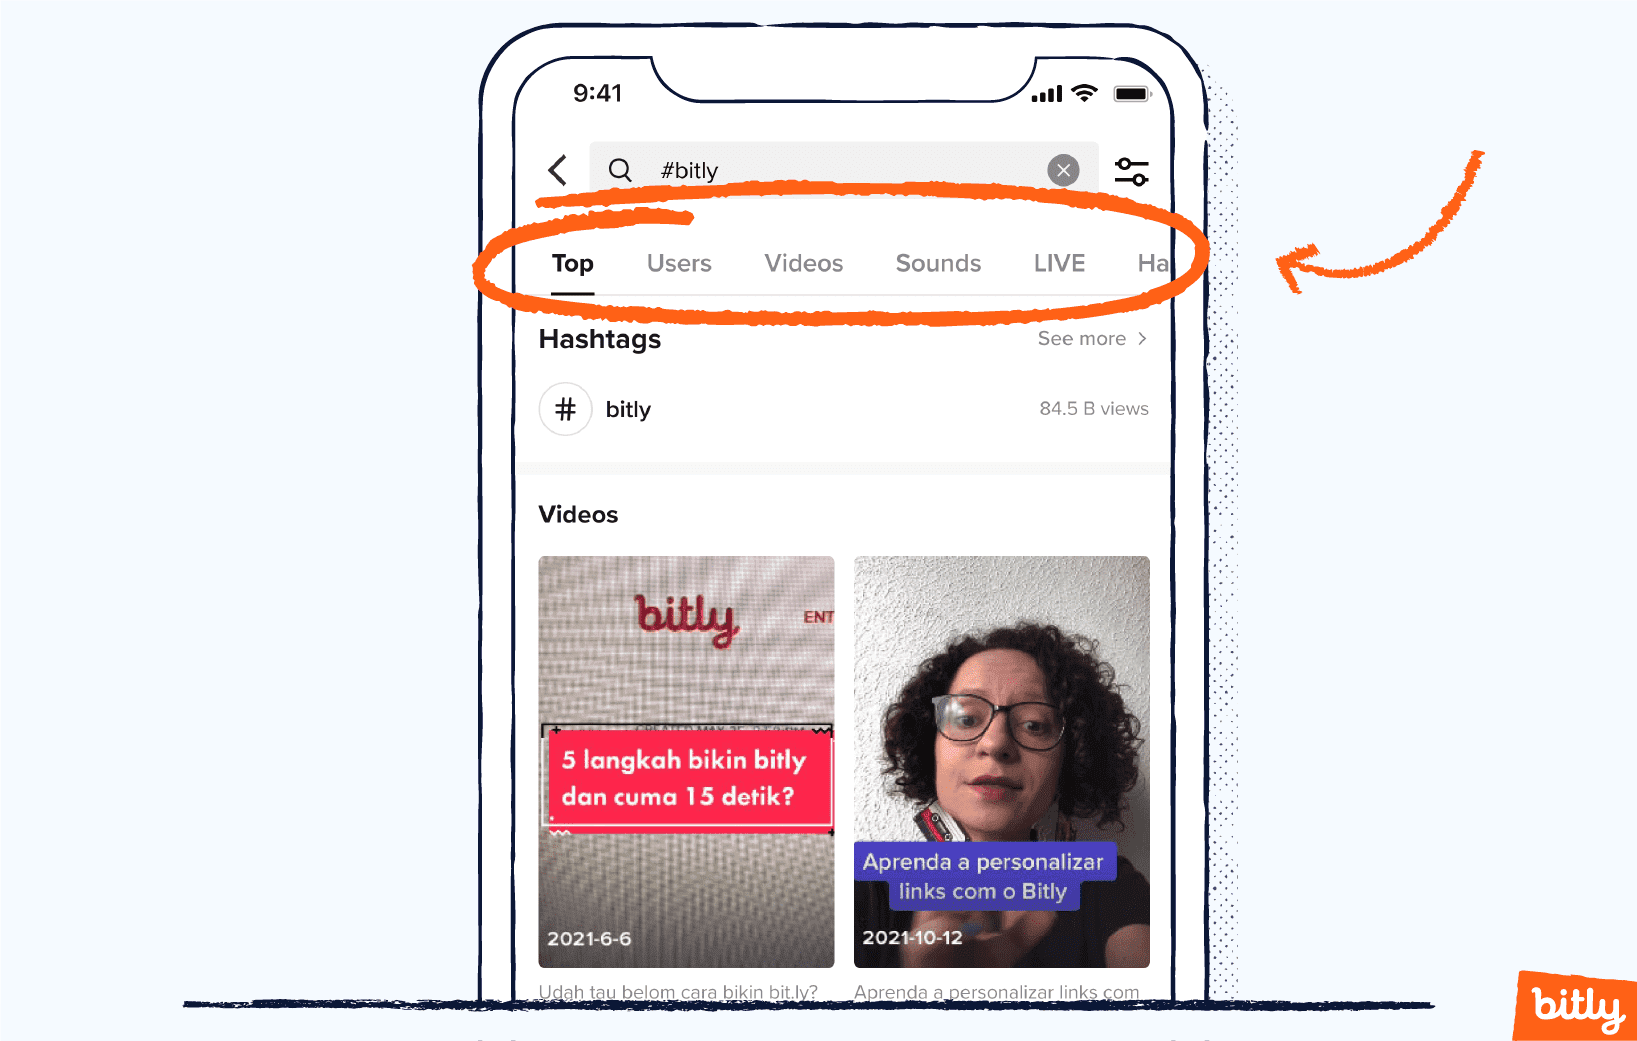
To gain additional insight into other users’ content, click on the magnifying glass on the top right corner of the TikTok home page to open the search bar. You’ll see a history of your recent searches, either by topic or hashtag.
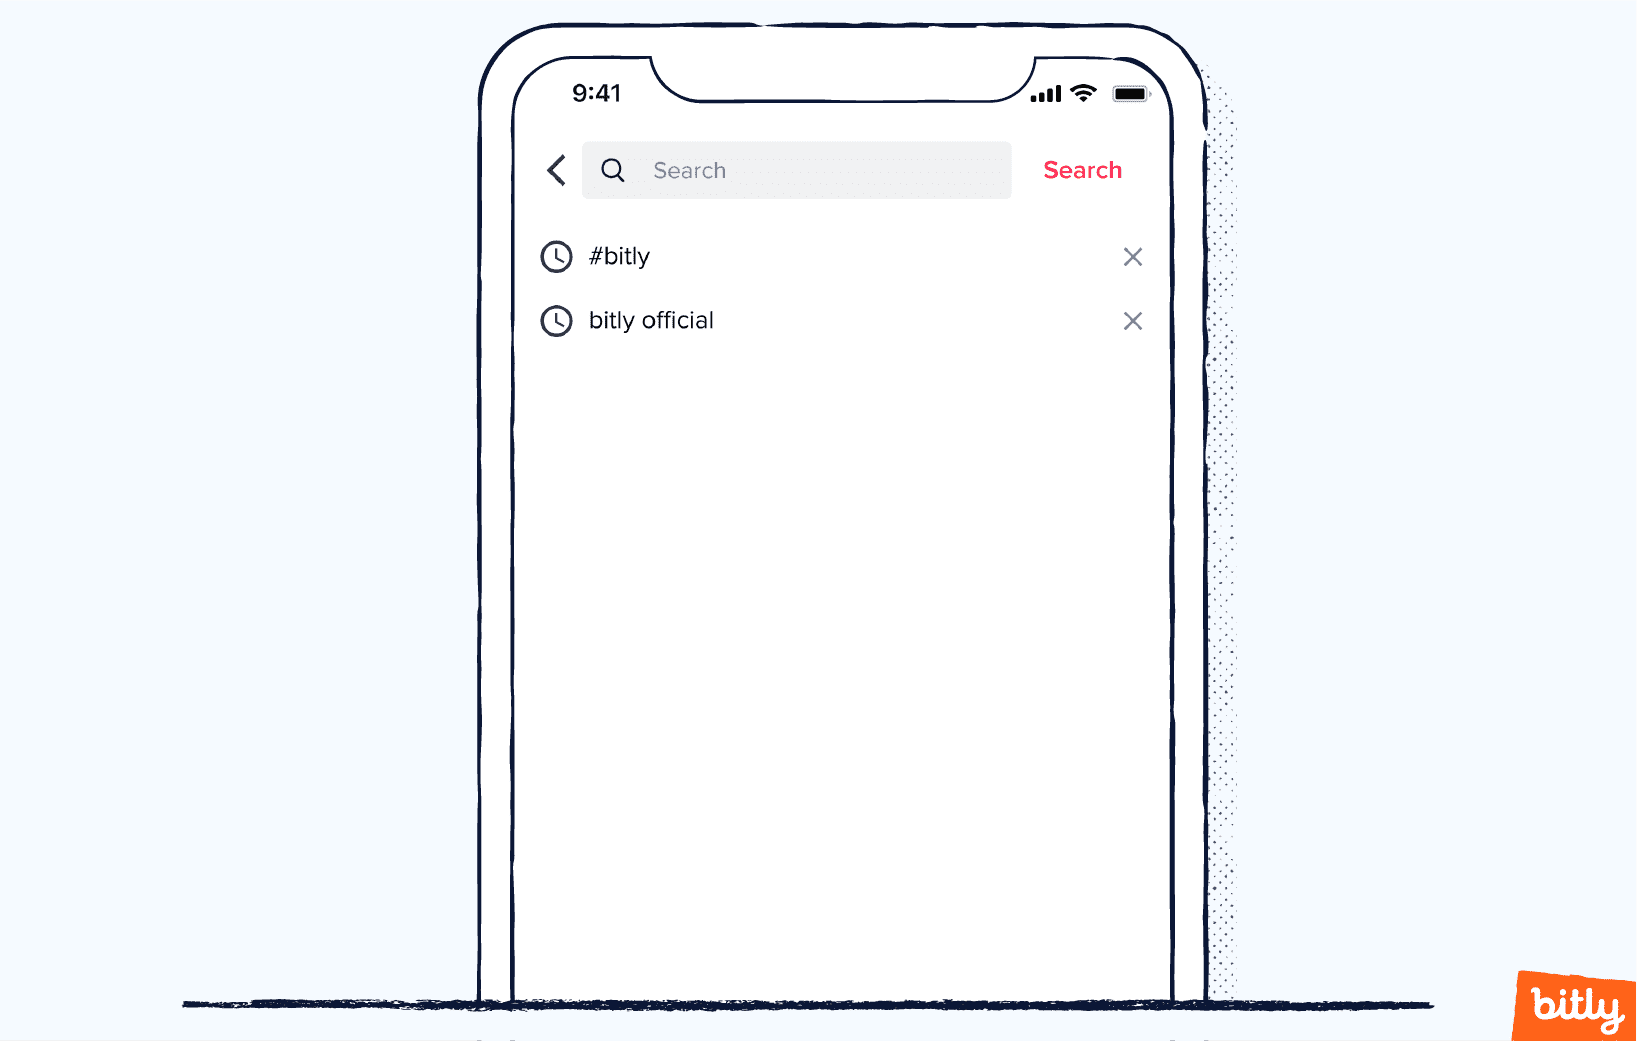
Enter a specific hashtag or topic, and TikTok will populate your screen with suggestions related to your search.
Hashtags on TikTok work just like on other social media platforms: They let you organize content by category and make it easy to search for the content you like. The power of a clever hashtag cannot be understated—organizers have built entire social and cultural movements surrounding a hashtag.
Add hashtags to a video to classify and organize it under that topic. TikTok’s algorithm most certainly considers hashtags when deciding which videos should land on the prized For You page that appears on everyone’s screen when they first open the app. Put simply, you cannot ignore hashtags when trying to attract viewers. So, it’s important to check out the analytics behind the hashtags you use to ensure your TikTok strategy optimizes the right words or phrases.
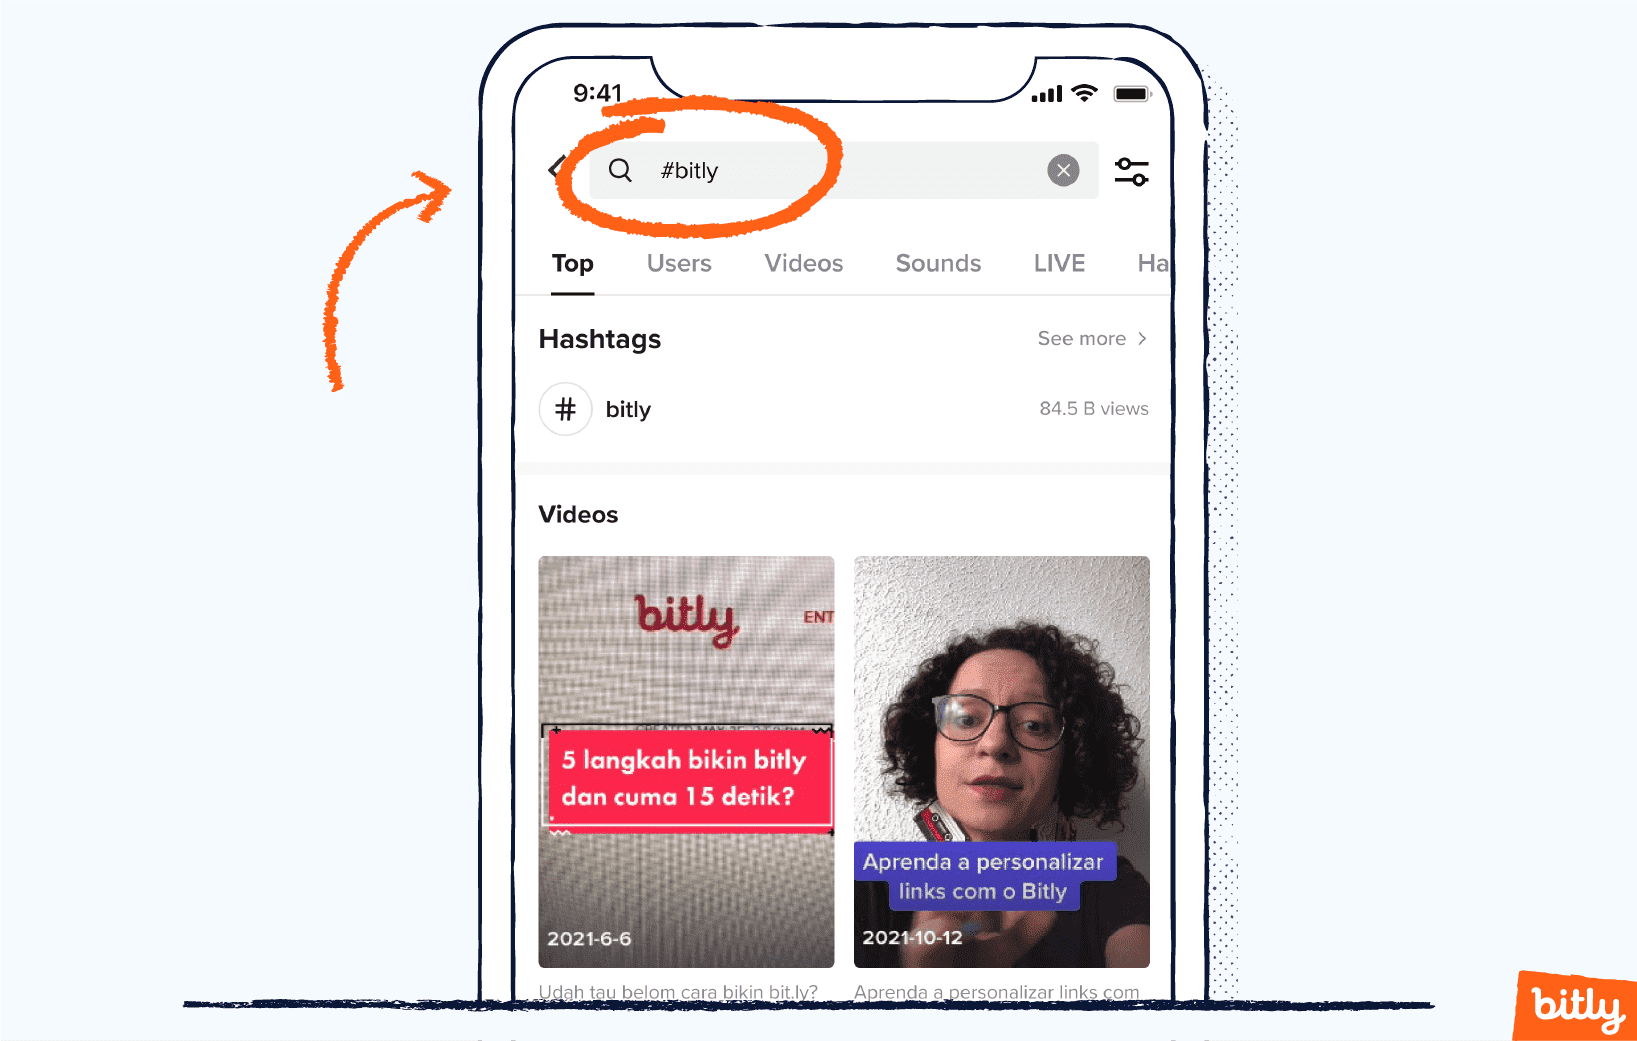
Check out these metrics to find out what types of videos, sounds, and hashtags are trending. You can toggle between them by selecting the category below the search bar. The category you are viewing will be underlined.
- Hashtag views
The number of times posts with a given hashtag have been viewed. Alone, this metric doesn’t reveal much. However, you can explore different hashtags based on viewer numbers to see if your posts include popular hashtags. On the other hand, you might be interested in finding a popular hashtag, but not so much that your video will be up against a ton of competition.
- Top videos
When you search for a hashtag, TikTok populates the Discover screen with the top videos (by views, comments, and shares). Scroll through this content and try to adopt common elements of the top videos into your content. TikTok replicates these same videos under the “Video” tab.
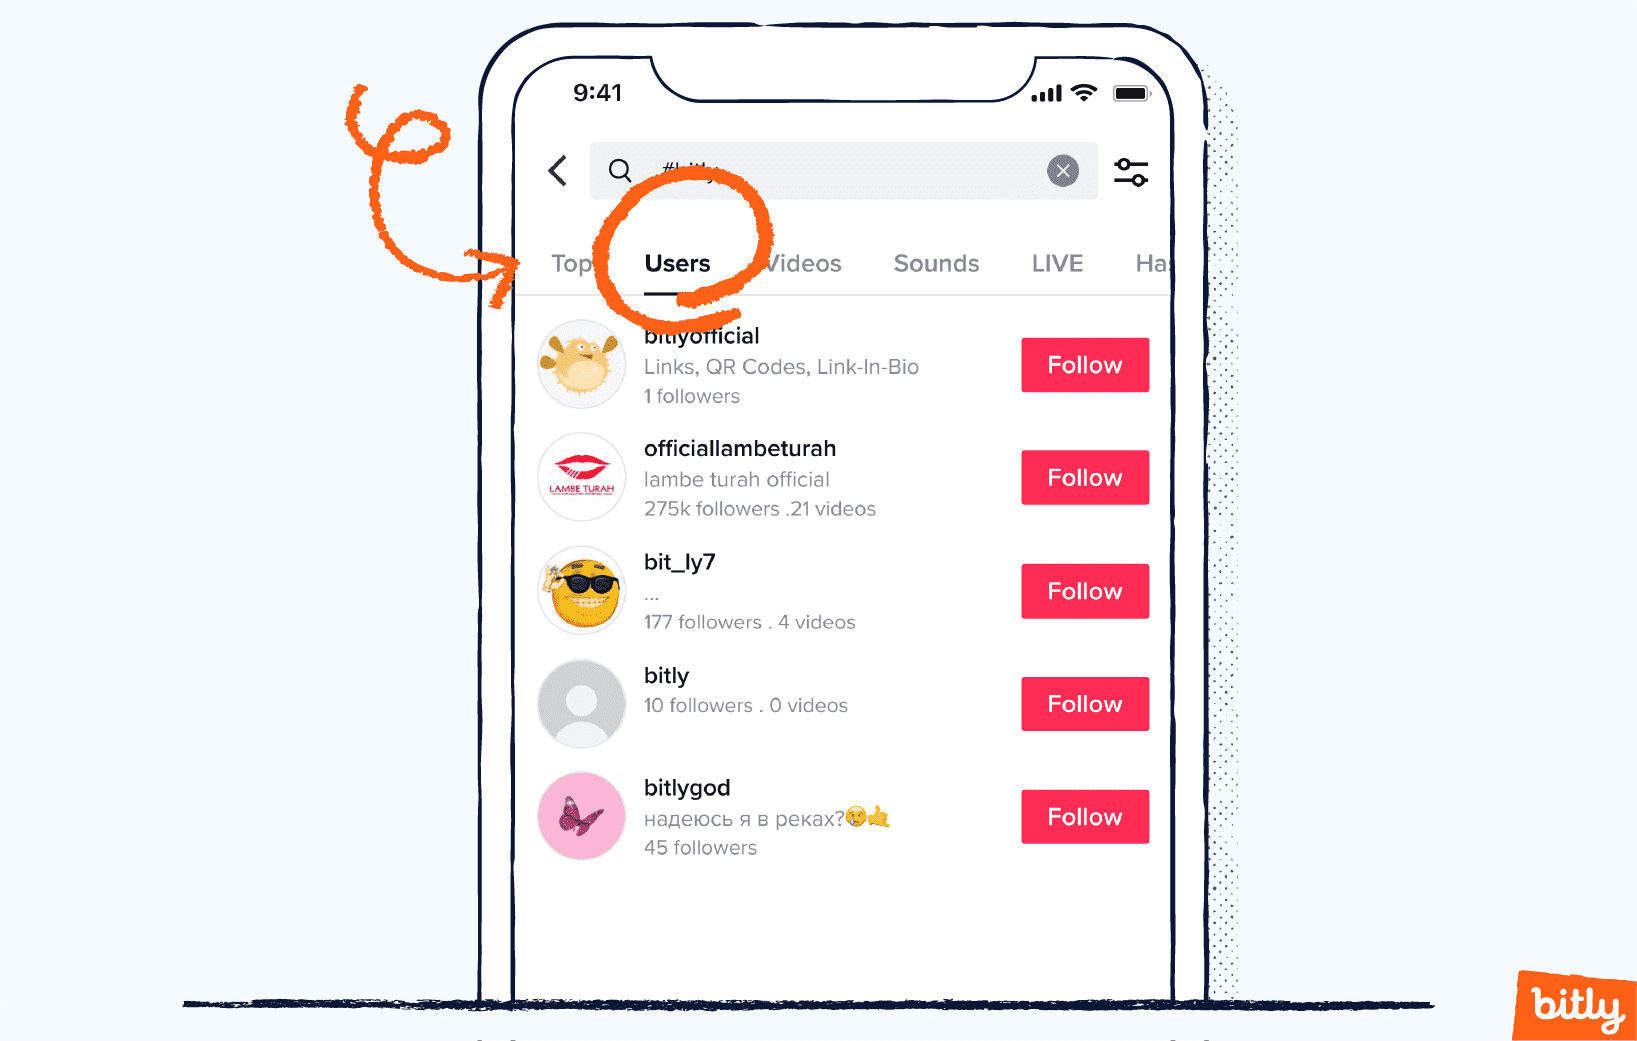
- Accounts and users
Select Accounts (for desktop) or Users (for mobile) in the Discover navigation under the search bar to see a list of the top accounts associated with the hashtag you used.
The following three categories only appear on the mobile app:
- Sounds
The sounds category features a list of the most popular sounds associated with the selected hashtag.
- LIVE
The LIVE tab shows you the current live videos related to your hashtag. It’s worth exploring some of these if you’re interested in using live content in your social media strategy.
- Hashtags
This section provides a list of other popular, related hashtags. TikTok doesn’t set a limit on hashtags as long as you stick within the 100-character caption limit. Explore these hashtags to find the perfect group of words to help launch your content into the coveted “For You” TikTok video stream.
Along with the data TikTok provides, you can make some quick calculations for even deeper insight:
- TikTok engagement rates
TikTok engagement rates calculate how your followers interact with your content. Essentially, engagement measures whether and how followers interact with your content. High engagement means a user finds the content personally relevant and meaningful. Users who are highly engaged with your content are much more likely to act on any calls to action, such as visiting your website, following you, or buying a product.
Engagement plays such a vital role in social media marketing that businesses even use formulas to measure it. Choosing which variables to include in your engagement formula will influence the results. For example, while some marketers include metrics like direct messages, replies, and clicks, others only consider comments and shares.
Among social media platforms, TikTok boasts high engagement rates. In a 2021 TikTok-sponsored study by the neuromarketing firm, Neuro-Insight, TikTok had a 15% stronger engagement than other social media platforms.
In fact, most sources rank TikTok as the number one platform when it comes to engagement rates. It isn’t easy to calculate an average TikTok engagement rate because sources use different formulas. However, according to a 2022 study by Socialinsider, which analyzed 27 million posts on TikTok, Instagram, Facebook, and Twitter, TikTok’s average engagement rate was 5.95%, compared with an average of 0.83% for the runner-up, Instagram.

Katie McKiever, a social media consultant, checks data from the social media management platform Hootsuite when advising her clients on engagement rates. McKiever notes that she advises her clients to fall within Hootsuite’s reported average range of 4.5% to 18% engagement. These numbers also agree with Rival IQ’s study. In its analysis of the TikTok accounts of 200 brands, the social media analytics firm reported a 4.5% median engagement.
This range is large, so McKiever adds, “Another way to gauge success on TikTok is to take your benchmark metrics and try to improve on those metrics by a percent or two month-over-month.”
Engagement rate formulas
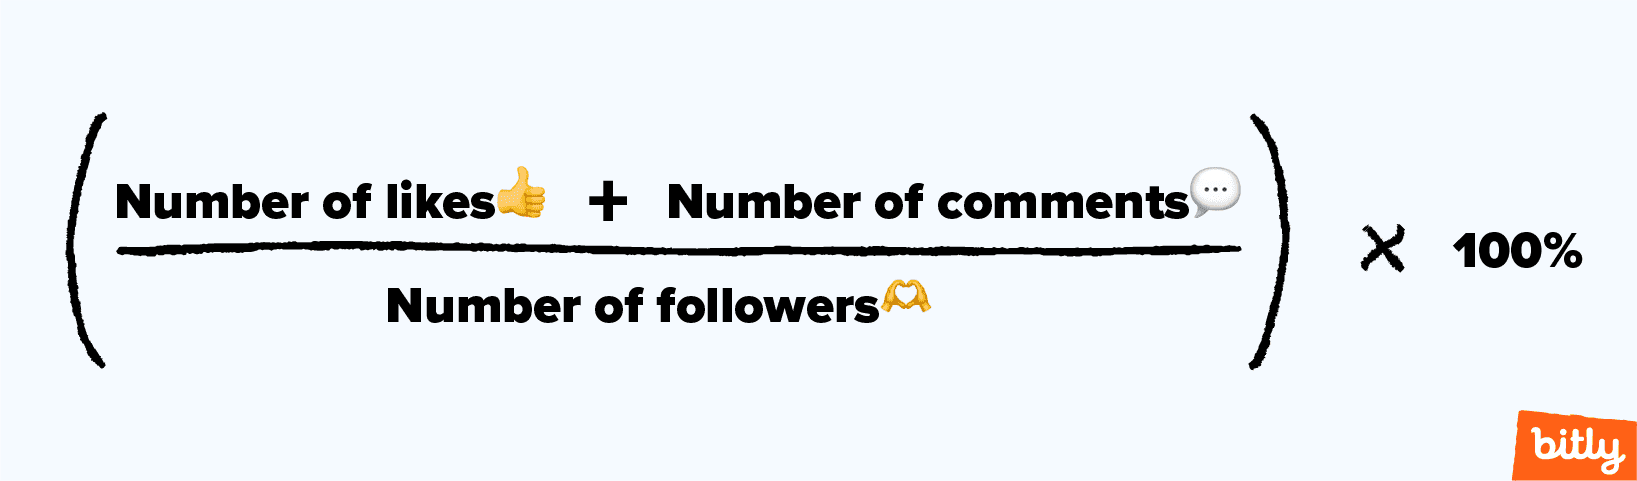
Unlike Instagram, direct messaging does not play a huge role on TikTok. For that reason, most marketers only consider likes, comments, followers, and shares when calculating engagement.
For TikTok, most marketers use the following equation to calculate the percent engagement per follower.
Some social media strategists also like to incorporate the number of shares into the equation:
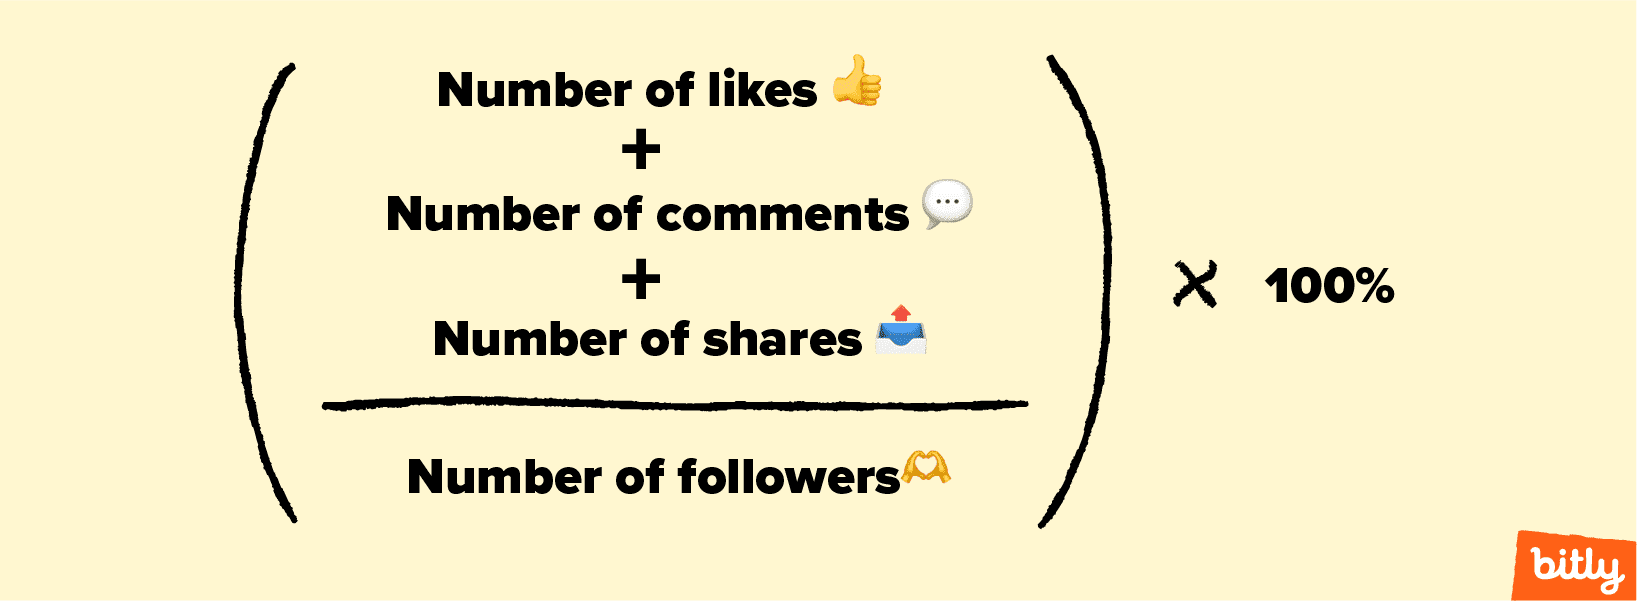
Both of these formulas paint a similar picture and answer the question: What percentage of my followers engage with my content? Both also calculate total engagement by account. If you want to check the engagement per video, simply use the likes, comments, and shares data per video.
- TikTok reach
TikTok reach refers to the number of unique TikTok viewers that have viewed your post at least once. Many marketers use TikTok reach as an estimate of brand awareness—the greater your reach, the greater your brand awareness.
To calculate reach, you need to go into the Content analytics tab and find the Reached audience metric. Unfortunately, there’s no simple way to calculate an account’s overall reach except for summing the reach of videos across a given time.
- TikTok impressions
Impressions measure the number of times an audience viewed your content, including multiple views from the same individual. So, one person can have multiple impressions on a single video. Marketers consider an impression to be anytime your content makes its way to someone’s feed, even if a viewer does not engage or even click on the content.
You can use the Video views metric by a video’s thumbnail under the Content tab to determine the impressions per video. You might notice that impressions can be much larger than the audience. That’s because a single viewer can have multiple impressions on the same video.
Put simply: Reach measures the number of unique people who saw your content, and impressions measure how many times an audience viewed your content.
Download our free TikTok metrics cheat sheet for a detailed summary of every metric.
Download TikTok metrics cheat sheet
How to Use TikTok Analytics to Grow Your Business
You can use TikTok analytics data to determine which content correlates with user engagement. Also, pay attention to trends in your niche. Then, adopt elements of successful videos into future content to increase follower count and brand awareness.
TikTok’s powerful analytics provide the data you need to make strategic moves. If you pay attention to certain metrics and assess how content performs, you’ll learn which content resonates with your target audience and which doesn’t. As you finetune your content marketing strategy, more followers will organically find your business, improving brand engagement and awareness.
According to social media consultant McKiever, “TikTok continues to live up to the hype of being the single platform that offers huge moments of organic virality and growth. For that reason, it’s the best place to keep track of your overall social media follower count. The native in-platform analytics like overall follower account, engagement rate, and video views all give you a quick snapshot of moments of interest on your account. These analytics are front and center on your screen when you open your page.”
How to Use TikTok Analytics to Expand Your Audience
To expand your audience on TikTok, pay attention to variables like reach, views, and engagement. You can also analyze other content and hashtags to see which videos become popular. Then use some of those techniques in your videos.
Social media strategist Spooner advises her clients hoping to increase their reach with a simple maxim:
“Businesses need to meet their audiences where they are. There are several metrics that I look at when gauging whether my content is helping me reach my audience or not. In the traffic by source metric, in the Followers tab, TikTok tells you where people find you, whether it’s on the For You page, through their following feed, or by going directly to your profile. Pay close attention to these data. The content that lands on the For You page is likely the type of content that helps new people discover you and gets rewarded by the algorithm. Also, keep an eye on videos that lead to a lot of new followers. That’s the magic combination of discovery and engagement that we all want when building a social media presence.”
Brendan Kane, author of the best-seller One Million Followers and managing partner at Hook Point, points out:
 “People use social media from a passive perspective: they post, but don’t analyze content. The reality is that you are competing against 4 billion people on social media — if you want to have a breakthrough in performance, you need to look at more than the in-app analytics. TikTok native analytics, especially the attention graph, provides foundational, core statistics. These data are inherently limiting because they only show you information on your best content. But what if you want to become better than yourself? Paying attention to frequency, hashtags, and time of day won’t give you the insight that will make a difference. Paying attention to how successful content creators tell stories will.”
How to Use TikTok Analytics to Increase Your Followers
To gain more followers, you can analyze the content you posted during intense periods of follower growth. Then, repeat similar tactics in future videos. You can also study other TikTok videos popular with your followers.
To convert viewers to followers, you need to convince users that you will regularly post content that they relate to and want to see more of. Try honing in on a period of follower growth, and watch the content you posted a week before and during this time. Take note of the elements common to these videos, be it length, subject, or even songs. Now, you have a short list of what may correlate with followers.
Troubleshooting TikTok Analytics
If you have problems accessing TikTok analytics, make sure that you have switched to a business account and have posted at least one public video. Also, you will need to wait seven days before data populates.
Many users report difficulty when accessing TikTok analytics. Almost always, if you can’t see analytics it’s because you don’t meet one of the company’s requirements.
If you can’t see your TikTok analytics, check the following:
- Do you have a business account?
If not, follow these steps to switch from a standard to a business account. Be aware that business account users lose access to some sounds and can’t have private accounts (but they can still post private videos).
- Have you posted at least one public video?
You won’t see analytics if TikTok doesn’t have any videos to analyze.
- Have you waited seven days since becoming a business member?
TikTok takes up to seven days to populate your analytics field from the day you become a business member. Also, TikTok will only show data for videos published after you switch to a business account.
- Do you meet the requirements listed under the metric?
Some metrics only appear if you meet additional requirements. For example, some data on follower behavior requires that you have at least 100 followers. TikTok makes these requirements obvious.
- Have you cleared your TikTok in-app cache?
If your TikTok mobile app performs poorly, your analytics may take a long time to load. In this case, try clearing your in-app cache data This process will remove temporary data that takes up storage space on your phone.
Also, be aware that you cannot see LIVE analytics if you don’t post any live videos.
TikTok Analytics FAQs
TikTok analytics can be confusing to navigate. We answer common FAQs, including how to calculate impressions and check key statistics. Learn how many followers you need before you can access key metrics.
Here are some answers to common TikTok analytics FAQs:
- How do I calculate impressions on TikTok?
TikTok doesn’t provide a native measurement of impressions. Instead, go to the Content tab and select a video. Underneath the video’s thumbnail, you will see the total number of views, which serves as a measurement of impressions because it does not only calculate unique views.
- What does “reached audience” mean on TikTok?
Reached audience measures the number of unique viewers that have watched your content. Unlike impressions, the reached audience does not include multiple views from the same account. You can find this metric in the Content tab. You need to have at least 100 followers before you gain access to this data.
- How do I check follower demographics?
Navigate to the Followers tab. TikTok provides information on audience gender and location.
- How do I see follower stats on TikTok?
Navigate to the Followers tab under Analytics to see statistics on follower count and demographics.
- How many TikTok followers do you need to see follower analytics?
You can see stats on total followers across seven days as soon as you gain access to analytics. But, to see data on gender, top territories, and follower activity, you need to reach 100 followers.
- How do I check TikTok video stats?
Find stats related to specific videos in the Content tab. TikTok won’t provide any stats on private videos, or videos that you posted before you had a business account.
TikTok Analytics Reporting
New and exciting online tools complement TikTok’s in-house analytics feature. Use these tools to automate reporting, analyze large chunks of data, and understand your competition’s engagement. Then you can set clear goals and measure progress.
TikTok’s in-app analytics comes with important data so you can optimize your video content and attract the followers you want. TikTok does have its limitations, however. For example, those looking for long-term insights and analysis will want data that covers more than the standard 28-day TikTok analysis cycle. Luckily, you can circumvent this issue by visiting the desktop version of TikTok and regularly exporting your data into .csv or .xslx formats. Once you download them, you can analyze them jointly later.
Additionally, the analytics feature provides minimal information on the analytics of your competitors. Of course, some of this data should remain confidential. But, with the help of additional tools, you can get coarse insight into how many likes, shares, and followers your competitors’ posts attract.
Also, many of these solutions have dashboards that offer a quick at-a-glance comparison, providing a macro-level picture of how your channels are performing.
Check out these free online tools that will help expand your TikTok and overall social media strategy by considering more data. Most of these tools have some free features, but to access their comprehensive packages, you’ll need to pay:
- Popsters
Popsters compares analytics of posts across social media pages. The app displays common data related to engagement, followers, and likes, and sorts posts based on activity. You can also compare your TikTok posts based on several variables, like hashtags or time of posting. Popsters features the ability to export your data to various file formats, including .xlsx and .pdf.
- Pentos
Pentos brands itself as the best way to track your peers and compare data with your competitors. Pentos features a dashboard that compares multiple accounts in one place, monitors videos for virality, monitors average song length, and measures broad hashtag trends.
- TikRank
TikRank maintains a database of around one million influencers. Here, brands can find the perfect influencer for potential collaborations. TikRank keeps data on the number of views, fans, and videos per influencer. Also, you can use TikRank to bulk download TikTok videos. TikRank’s features are basic, but free.
- Socialinsider
Socialinsider markets its single dashboard as the ultimate social media analytics solution. The tool tracks important social performance metrics across different platforms for your accounts and those of your competitors. Also, you’ll find data to help hone your content strategy, like trends specific to your niche.
- Analisa
Analisa runs on artificial intelligence and offers access to raw data, along with analytics. You can get free information on hashtags and profiles.


